
Only 7.88% of new users are still active on day 30, according to OneSignal's 2024 mobile-app benchmark across 12 app categories. Read that backwards and it becomes a statement about monthly active users. Most of the MAU you'll report next month is already gone by the end of this week, and buying more traffic doesn't change the ratio.
That's why I treat MAU as a diagnostic, not a growth target. A metric that counts anyone who opened the product in 30 days will happily reward a one-time visit, an incentive, or a broad push blast. It won't tell you whether a single person got the thing they came for. Teams that move monthly active users do three unglamorous things: they define an active user around a value event, they read the number by cohort, and they fix retention before they scale acquisition. The benchmark above comes from mobile apps, so treat it as a reference point rather than a law, but the shape of the curve holds across SaaS, developer tools, and AI products too.
What follows is the operating version of how to increase monthly active users without inflating the number. Every recommendation ties back to a definition you can defend to a backer, a board, or yourself at 11pm.
Table of Contents
- Measure Active Users by Cohort First
- Lift Day-7 and Day-30 Retention
- Re-engage Users Without Notification Fatigue
- Keep MAU Gains Honest and Traceable
- Run Your First Activation Experiment Step by Step
Measure Active Users by Cohort First
Two products can report the same MAU while having very different health. In one, users return to complete the product's core job. In the other, many sign-ups leave before reaching it. Break the number down by cohort and value event before deciding what to change.
| Metric | How to calculate it | Benchmark or signal |
|---|---|---|
| Activation rate | Users who finish the value event within 7 days ÷ new sign-ups | Median 32% at day 7 across 213 B2B SaaS companies |
| Day-7 retention | Cohort users active on day 7 ÷ cohort size | 17.86% average across 12 app categories |
| Day-30 retention | Cohort users active on day 30 ÷ cohort size | 7.88% average; 10% is a useful first target |
| DAU/MAU ratio | Average daily actives ÷ monthly actives | Read the 90-day trend; a rising ratio with flat MAU can mean the same users are returning more often |
| Median time-to-value | Median time from sign-up to first value event | Track the median, not the mean |
Use the activation figure as a reference, not a universal target. Userflow's product adoption metrics analysis reports a 32% median day-7 activation rate across 213 B2B SaaS companies and 14.6 million trial users, with a ±2.4 percentage-point 95% confidence interval.
Report the Median, Not the Mean
A small number of users with unusually long setup times can pull the average upward. The median shows how long the typical user takes to reach the first value event. Track it by sign-up cohort so a change in onboarding can be compared with the users who experienced it.
Read the scorecard as a set of signals, not five independent targets. The relationship between early activation and later retention can help identify where the funnel is losing users. Affective's review of the app metrics investors care about reports that 69% of products with strong early activation also achieved strong three-month retention, and notes that MAU and DAU alone do not explain user behavior. For additional engagement measures, see AI Optimization Services engagement benchmarks.
A clear event definition makes the scorecard actionable. The SaaS usage metrics worth instrumenting first can help you choose which product actions to track. Then check that each event fires consistently and represents genuine progress toward the user's intended outcome.
Suppose a dashboard reports 2,000 monthly actives, unchanged for four months. Split that cohort by acquisition source: users from one paid channel leave before day 7, while referrals activate later and remain active at day 30. The blended MAU hides the difference. Improve the weak channel's onboarding or stop spending on it; adding traffic would only bring more low-intent users into the same funnel.
Before changing the product, write down the value event in one sentence and record each scorecard metric as your baseline. If removing low-intent users lowers MAU but improves activation and cohort retention, that is healthier growth than a larger number built on one-time visits.
Lift Day-7 and Day-30 Retention
The retention curve is where the MAU arithmetic happens. Across the 12 categories OneSignal measured, the average was 28.29% on day 1, 17.86% on day 7, and 7.88% on day 30. Find your row before you set a target.
| Category | Day-1 | Day-7 | Day-30 |
|---|---|---|---|
| All 12 categories (average) | 28.29% | 17.86% | 7.88% |
| Productivity apps | 32.86% | 24.23% | 9.63% |
| Lifestyle apps | 25.00% | 13.13% | 5.94% |
Translate the average to a cohort of 1,000. Roughly 283 come back the next day, 179 after a week, and 79 are still active at day 30. That's the funnel operating in the background of every acquisition campaign you run.
What the Category Gap Actually Means
The spread between productivity and lifestyle apps is not noise, it's product physics. A tool someone uses for work has an external reason to return: a report due, a build to check, a metric a teammate asks about. A consumer habit has to be rebuilt every single session. If you sell to founders, developers, or course creators, you're closer to the productivity row, and holding yourself to a blended 7.88% day-30 average lets you off too easily.
Four levers do most of the work here, and none of them require new users.
- End the first session on the value event. Prefill a sample project so a new creator reaches a populated dashboard or a live page instead of an empty state.
- Route onboarding straight to the action. Every screen between signup and first publish is somewhere to lose someone. Tours teach; a finished first task retains.
- Remind people about unfinished work. One message when a connection has sat half-configured for three days beats a weekly newsletter nobody opens.
- Give a recurring reason to return. A weekly summary per published page, or a milestone alert when a tracked number crosses a threshold, creates a return trip that has nothing to do with willpower.
The compounding is easier to see in relative terms. Moving day-30 retention from 7.88% to 10% produces about 27% more retained users from identical acquisition volume, assuming other conditions hold. That's a quarter more MAU from work you were going to do anyway.
Acquisition buys you a cohort. Retention decides what the cohort is worth. A team that doubles spend while day-30 retention stays flat has simply bought twice as many people who will leave.
For the program around those numbers, MakeAutomation's SaaS customer retention strategies covers the lifecycle work that sits upstream of any single tactic.
Pick your category row, write your day-7 and day-30 targets next to it, and attach every planned change to one of those two numbers. If a change can't move either, it's a redesign, not a growth project.
Re-engage Users Without Notification Fatigue
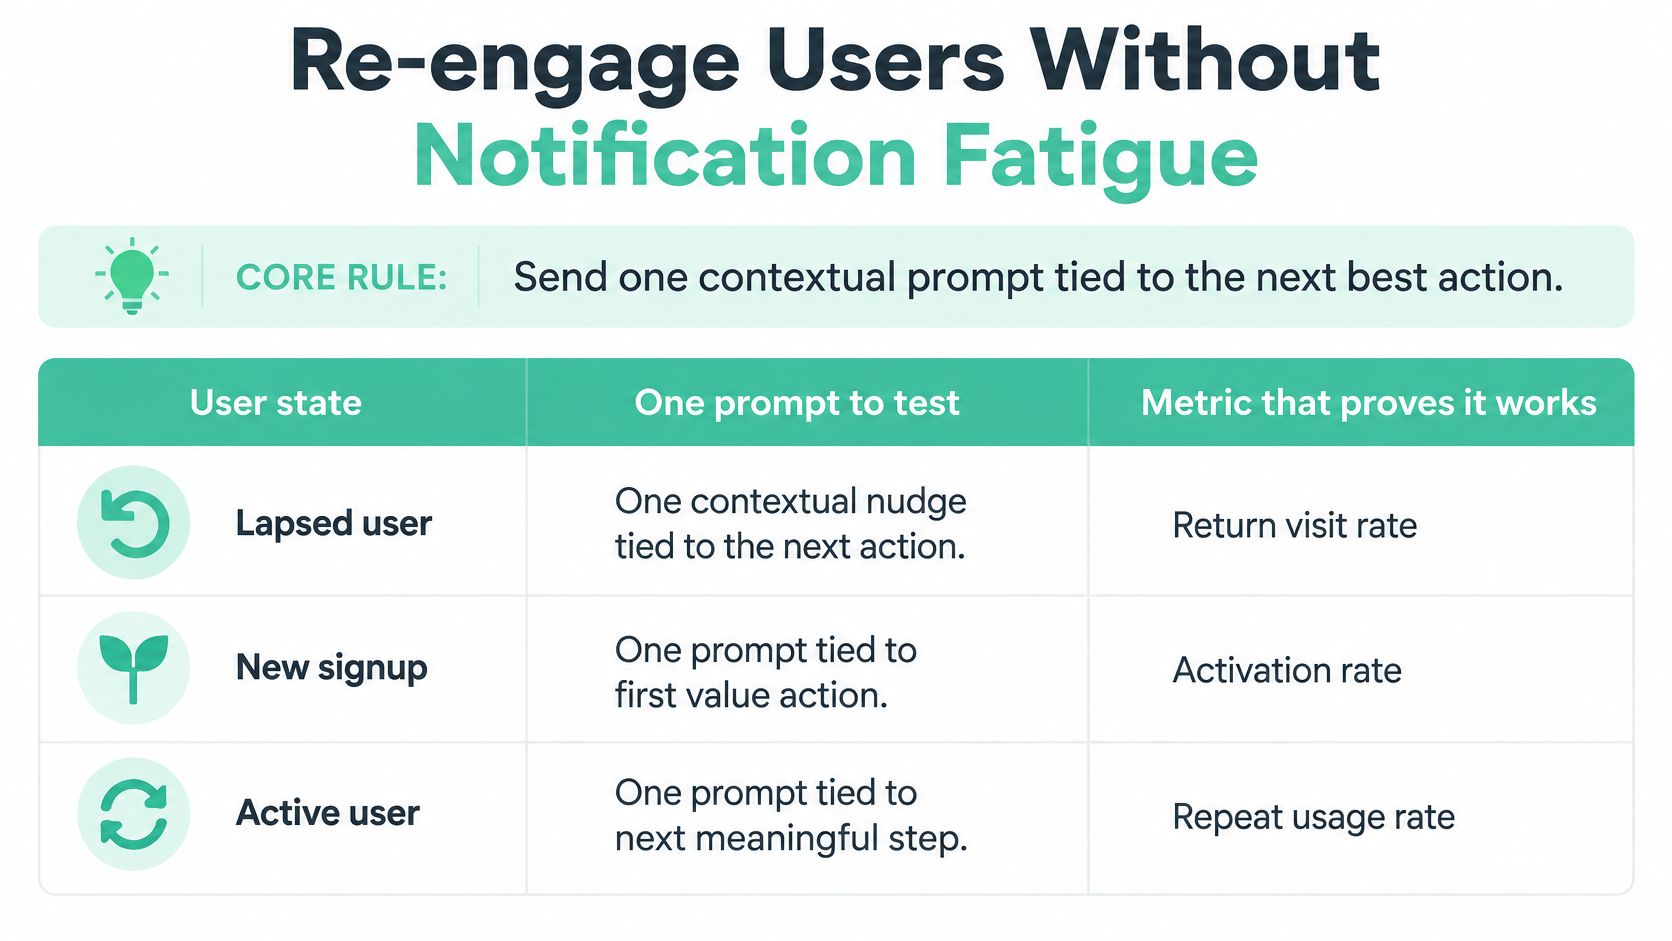
The fastest way to make a MAU chart look healthy for a month is a broadcast notification. It's also the fastest way to teach users to ignore you. The alternative isn't fewer messages, it's better-targeted ones: one contextual prompt per user state, tied to the next value action.
The evidence should make you cautious about blanket sends. A randomized notification study found that notifications increased the probability of opening an app during the immediate hour by 3.5 times, but fixed daily or random notification policies did not lengthen time to disengagement or increase engagement over the first 30 days, according to the randomized trial indexed in PubMed Central. Notifications win the hour. They don't win the month.
| User state | Prompt to test | Success metric |
|---|---|---|
| Data connection unfinished | Remind about the one missing connection | Connection completed within 3 days |
| Traction page published, never shared | Suggest sharing with one named contact | Share rate and return visit |
| Page shared, no repeat visit | Send a refreshed metric or milestone update | Day-30 return rate |
| Backer viewed projects, did not pledge | Send an update on one followed project | Return visit to that project |
The Guardrails That Keep Prompts Welcome
- Cap frequency at one prompt per state per week. Two messages about the same unfinished task reads as nagging, and nagging drives opt-outs.
- Respect local time. A send at 3am local costs you more trust than it buys attention.
- Give a one-click opt-out per channel. Making people hunt through settings to stop messages is how you get app uninstalls instead.
- Never send a message that doesn't name the next action. If you can't say which screen the user should land on, there's no message worth sending.
Track delivery, open rate, target-action completion, day-7 and day-30 retention for the treated cohort, and unsubscribe or disable rates side by side. A prompt that lifts opens while disable rates climb is a loss dressed as a win.
The trap is optimizing opens. Short-term attention can rise while durable MAU never moves. Ship only the treatments that improve returning active users and the value action you defined, and hold everything else.
Predefine a minimum detectable lift and report confidence intervals before each test, not after. A 40-person treatment group can show a beautiful percentage that means nothing.
Keep MAU Gains Honest and Traceable
A rise in monthly active users is a signal to investigate, not proof of growth. Platform mix alone can shift the total: reported average MAU rates run 18.99% on iOS against 34.27% on Android, according to Pushwoosh's benchmark breakdown of monthly active users. If your product serves users on both platforms, track them separately before treating a blended figure as evidence of stronger adoption.

Use permissioned first-party channels rather than purchased audiences, and track opt-outs alongside reactivation. A higher active-user count can conceal users who disengage or leave.
Write the Mechanism Beside the Number
For every MAU change, log the date, the mechanism, and the day-30 retention change for the affected cohort. Name the actual cause, such as a product improvement, community event, release, or message. Without that record, several changes made in the same period can make the cause impossible to identify.
Before publishing the figure, ask: did activated users return, or did opens, incentives, and broad notifications drive the increase?
Cutting low-intent users can lower MAU while improving product health. If the remaining users return because they get value, the smaller number may be a better sign than a temporary lift from drive-by traffic.
Check how to improve data accuracy across your analytics stack before drawing conclusions from a change in the metric. If you can't explain why MAU moved, report it as an open question, then investigate.
Run Your First Activation Experiment Step by Step
One change, one cohort split, one decision. That's the whole discipline, and it's the part teams often skip in favor of shipping five onboarding tweaks at once and learning nothing.
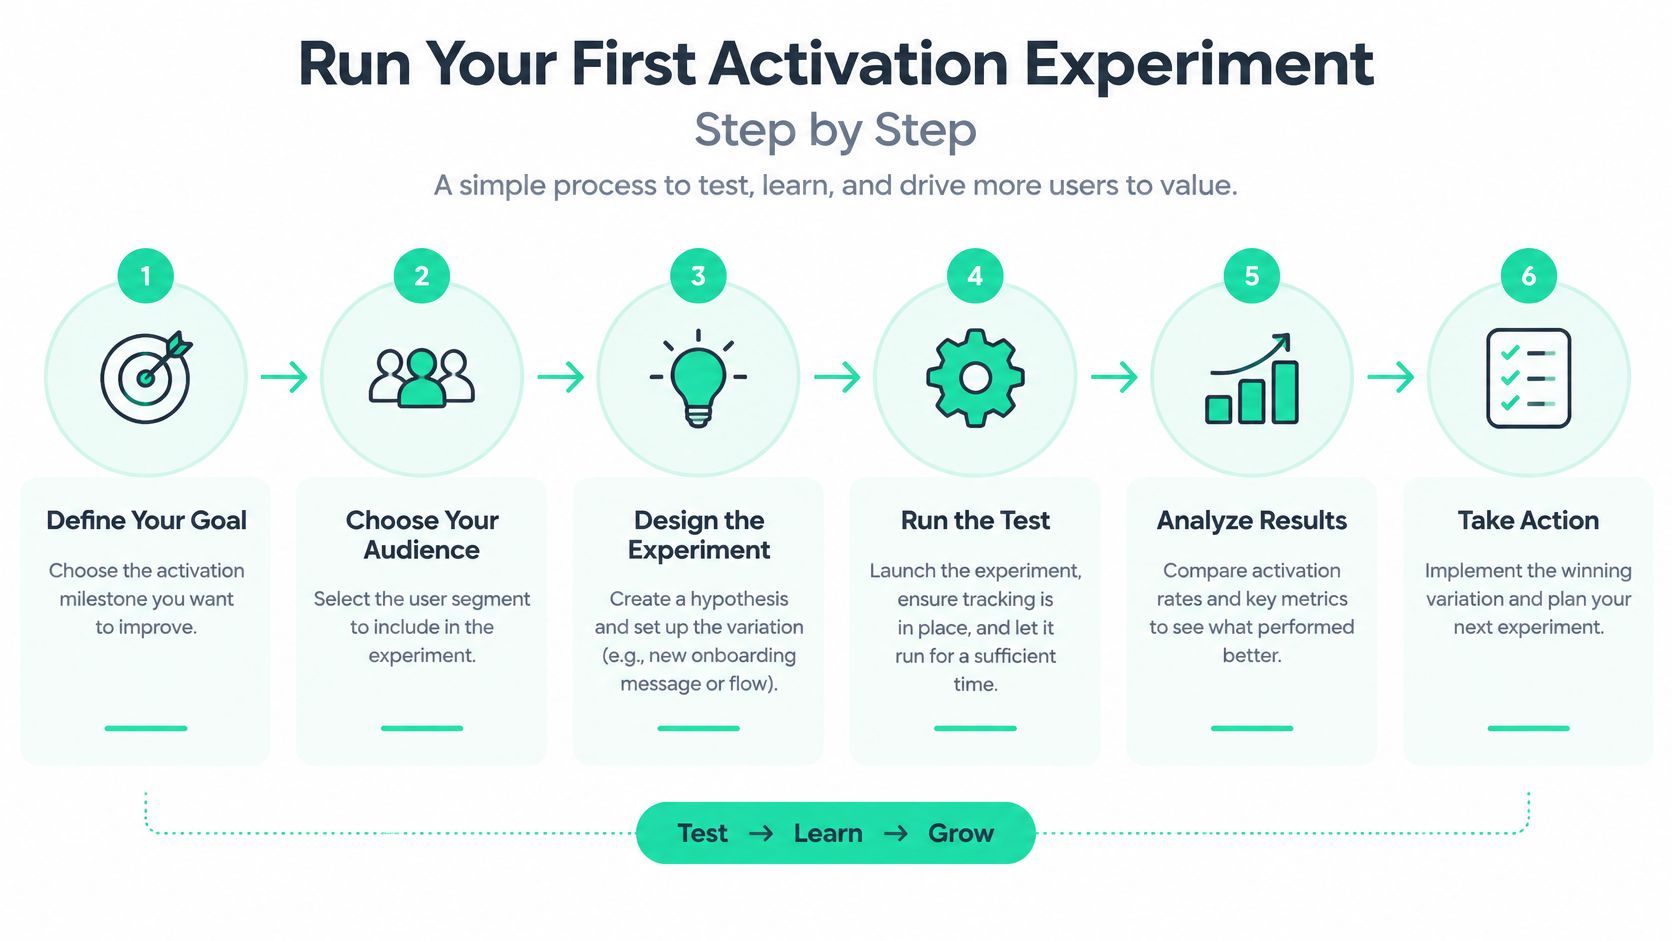
Write the value event in one sentence. The smallest action that proves your product did its job: a creator connecting one data source and publishing a live traction page, or a backer viewing two projects and saving one. The common slip is counting a login as activation, which measures intention rather than outcome.
Instrument five events. Signup, connection, first published or viewed page, return visit, contribution. Mixing paid and trial users in the same funnel is the slip that ruins the comparison before it starts, because paid cohorts behave differently and drag the baseline around. The event set behind the onboarding metrics that predict whether users stay is worth copying rather than inventing.
Calculate activation at 7 or 14 days, plus median time-to-value. Pick one window and keep it. Use the median, since a mean lets a handful of slow users redefine your onboarding quality.
Record the baseline, then find the largest drop-off. Look at activation, day-7, and day-30 for the same cohort. In most publishing and dashboard products the biggest cliff sits between connecting a source and shipping the first output, because that's where setup effort peaks and visible reward hasn't arrived yet.
Ship one intervention at a single funnel step. Prefilled sample data, OAuth-based integration, checklist progress, or a shareable page generated the moment a connection completes. On Fundl, a project's traction page is generated from connected sources rather than manual screenshots, setup takes about 5 minutes covering the funding goal, campaign timeline, and core project details, creating the page is free and doesn't need backers, and every project gets a shareable URL showing its live verified metrics in one link. Change one funnel step only. Changing three at once hides the cause and leaves you guessing which one worked.
Randomize new users into treatment and control, and decide at day 30. Set the minimum detectable lift and the success rule before launch, then judge on activated-user retention and incremental returning users. Not opens, not logins, not onboarding completion. If activated users retain better than control, keep it and move to the next drop-off. If they don't, drop it without ceremony and test something else.
The pattern that separates teams who compound MAU from teams who plateau is unglamorous: they run this loop every two weeks, log what they learned, and resist the urge to relabel a redesign as an experiment.
Fundl exists for the step where you need proof, not promises. Connect Stripe, GitHub, and your analytics to publish a shareable traction page that refreshes automatically, so the retention and MAU numbers you've just learned to measure become visible evidence a backer can check before contributing. Start a free project page and put your live metrics where your pitch is, at Fundl.