

Monthly recurring revenue is the sum of every active subscription's monthly-normalized price, and for an early-stage SaaS company a 10-20% monthly increase is a common target to measure that figure against. Many teams stop at the number itself: they compute it once, chart it, and treat the slope as a verdict on the business. A rising line can coexist with a shrinking customer base, and the fix isn't a cleverer formula. It's deciding what belongs in the number, tracking the five movements that produced it, and knowing which benchmarks mean anything when you have twelve customers instead of twelve hundred.
The most repeated advice on this topic is that MRR equals paying customers times average revenue per customer, and that up means healthy. That shorthand is a forecast, not a measurement: average revenue per customer is itself derived from MRR, so multiplying the two back together returns the number you started with. It also hides composition. A month where you add four small accounts and lose one large one can post positive growth while concentration worsens and retention breaks.
This guide works from the subscription level up, because that's the only level where the number can be checked against something real.
Table of Contents
- What Monthly Recurring Revenue Means for a SaaS Business
- The MRR Formula and a Worked Example
- What Counts Toward MRR and What to Leave Out
- The MRR Bridge from One Month to the Next
- Reading Benchmarks With a Handful of Customers
- When Usage-Based Pricing Distorts MRR
- Set Up MRR Tracking and Share Verified Numbers
What Monthly Recurring Revenue Means for a SaaS Business
A chart that climbs for six straight months can belong to a business that lost customers in every one of those months. The line records a total, and totals hide composition.
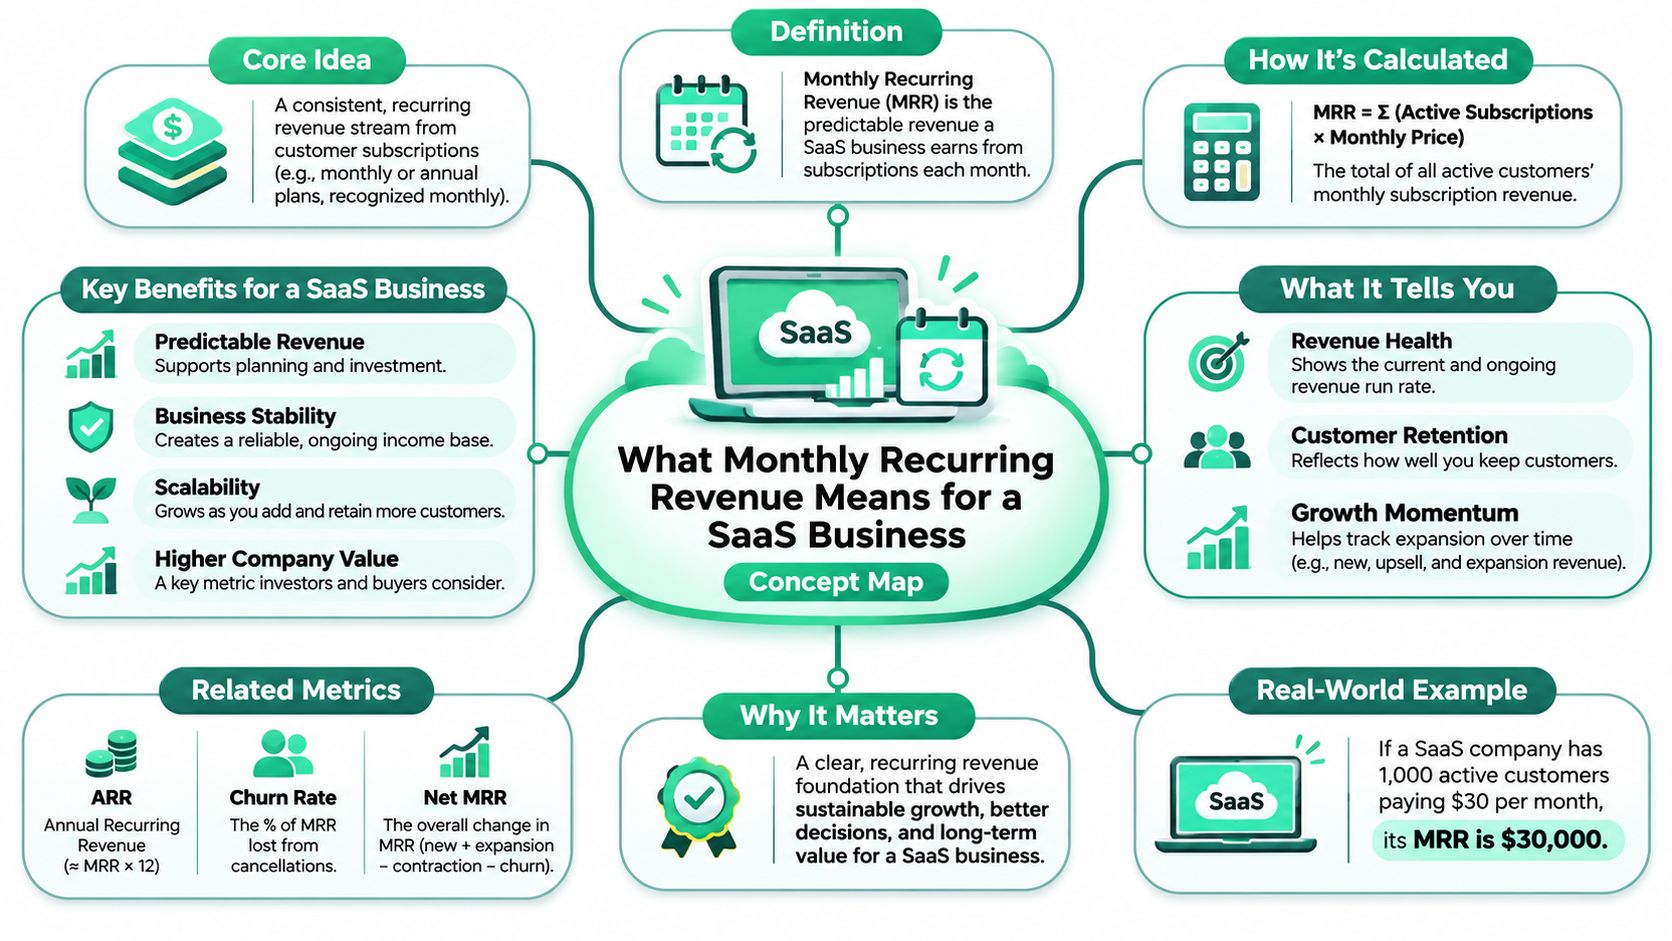
Monthly recurring revenue is the revenue a SaaS business can expect to collect every month from subscriptions that are already active: monthly plans at their current price, annual plans divided by twelve, and recurring add-ons such as extra seats or premium modules. It's a run rate, not a receipt.
Think of it like a salary. MRR is the paycheck you budget rent against. Setup fees, onboarding projects and one-off consulting are the bonus: welcome when it lands, impossible to build a plan on.
The cash in your account is a different number
A customer who pays $1,200 upfront for a year hands you $1,200 in January and nothing for the next eleven months. Their contribution to MRR is $100 in each of those months. Confuse the two and January looks like a record, the rest of the year looks like decline, and a stable business looks volatile.
Bookings behave the same way. A contract signed today that starts in six weeks is neither cash nor MRR yet.
ARR is the same number in annual units
ARR = MRR × 12. A product at $8,250 of MRR is a $99,000 ARR business. Nothing new is measured; the figure is restated for a year, which is why the two should never disagree in a deck.
Founders track monthly recurring revenue in SaaS work because pricing changes, runway math, valuations and investor updates all run on it. That's exactly why it has to be measured the same way every month, with the trail visible.
The MRR Formula and a Worked Example
The formula is one line: MRR equals the sum of every active subscription's monthly-normalized price. For each subscription, take the recurring price after recurring discounts, exclude tax and one-time fees, divide by the number of months in the billing interval (12 for annual, 3 for quarterly, 1 for monthly), then add every result together.
There's a shortcut people love: paying customers × average revenue per customer. It's fine for a quick sanity check and useless for reporting, because average revenue per customer is calculated from MRR in the first place. Multiply and divide by the same variable and you've learned nothing about whether the underlying list is right.
A snapshot from a 60-customer product
Three plans, sixty accounts, all billed monthly:
- $49 plan, 40 customers: $1,960
- $199 plan, 15 customers: $2,985
- $499 plan, 5 customers: $2,495
Total: $7,440 of MRR across 60 customers, an average of $124 per account. That's the balance at a point in time. It says nothing about how the month went, which is why the next step is to classify every change between two month-ends.
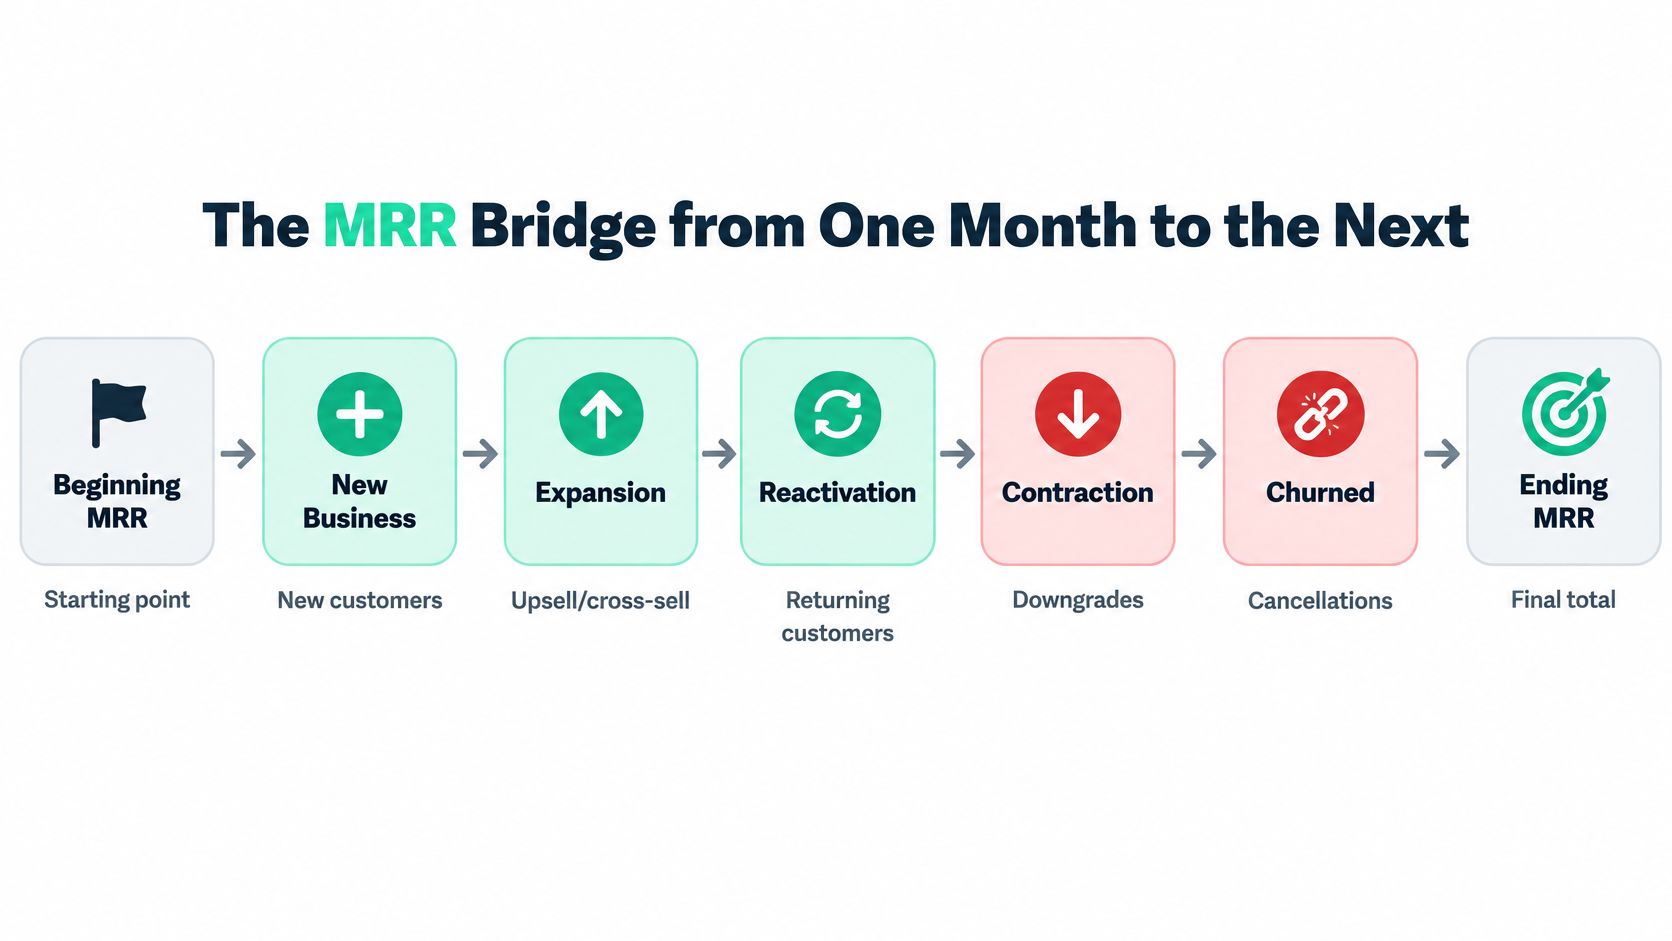
The five movements that change the total
| Component | What it covers | Example this month |
|---|---|---|
| New business MRR | First paid invoices from brand-new customers | +$1,200 |
| Expansion MRR | Upgrades, added seats, and add-ons from existing customers | +$300 |
| Reactivation MRR | Former customers who return to a paid plan | $0 |
| Contraction MRR | Downgrades to cheaper plans and seat reductions | -$150 |
| Churned MRR | Cancellations of active subscriptions | -$540 |
| Net new MRR | All five movements combined | +$810 |
Net new MRR of +$810 takes the balance from $7,440 to $8,250.
Two details in that month carry weight. Expansion and contraction both happened, and both get recorded: one customer upgraded, another downgraded, and the two don't cancel each other out in the ledger even though they net out in the total. And $540 of churn ate two-thirds of the $810 of net new revenue, which means a decent month did most of its work refilling a hole rather than building on last month's base.
You can now compute any month's MRR from your own plan list. Two fixes make the number trustworthy: cleaning the inputs so the list is accurate, and reading the movement so you know what the total is made of.
What Counts Toward MRR and What to Leave Out
Two teams can apply the same formula to the same billing data and get different answers, because the formula is short and the edge cases aren't. Decide each rule once, write it down, and apply it identically every month.
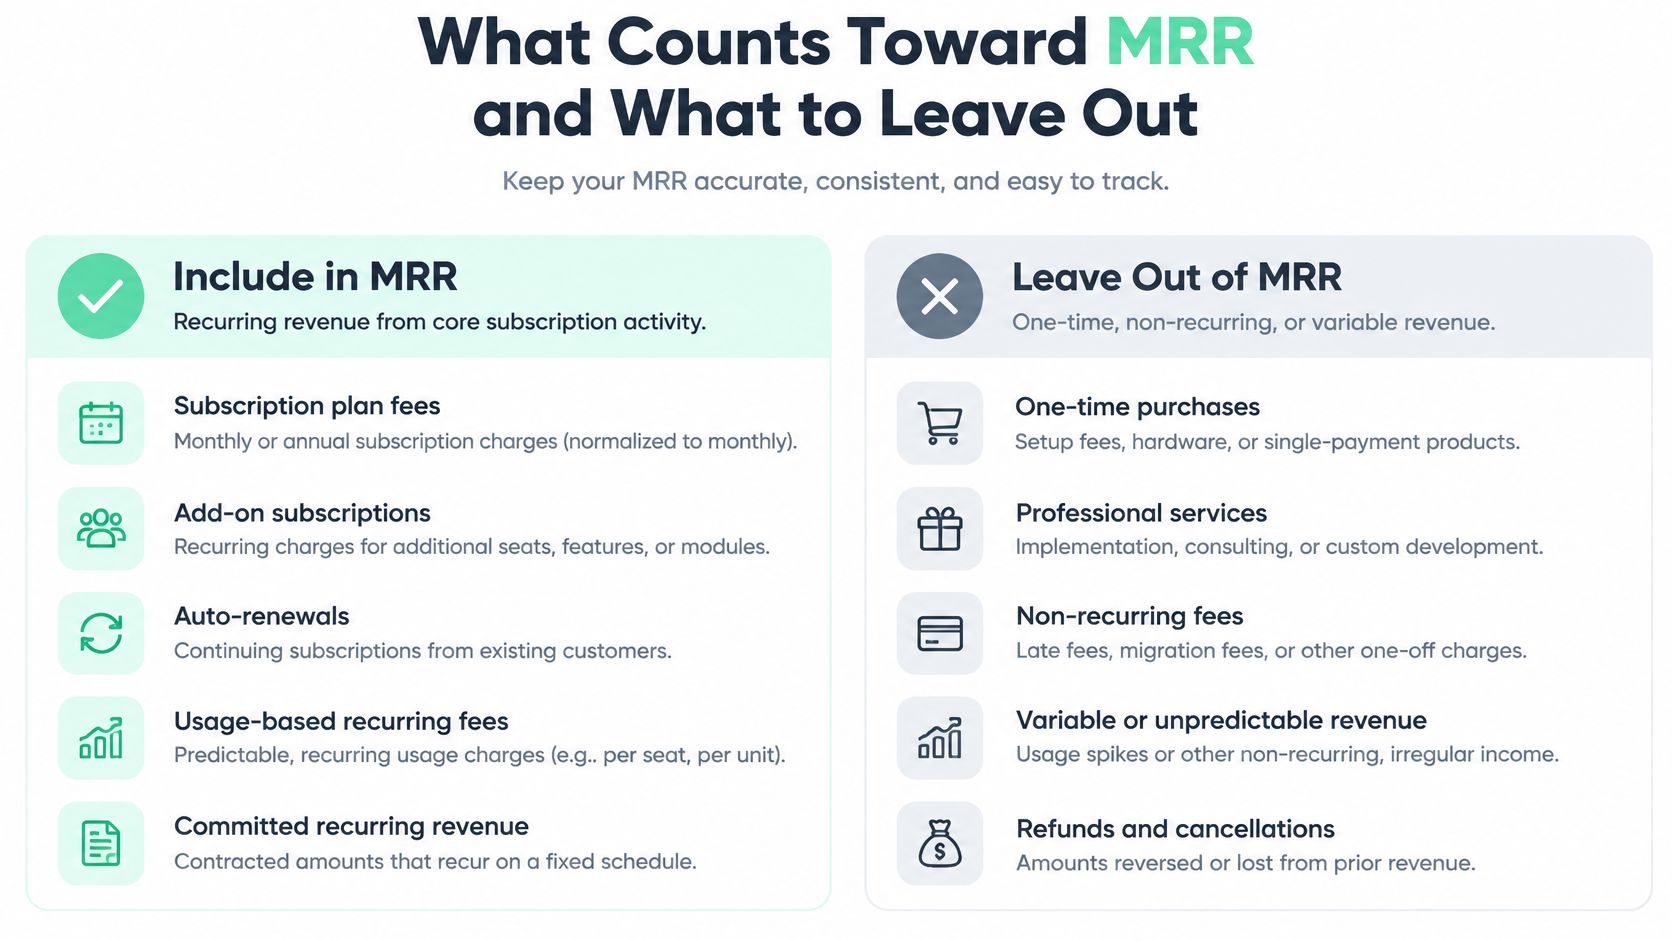
What goes in
- Monthly plans at the post-discount price. A $400 plan with 25% off for twelve months contributes $300 while that discount runs, then $400 when it expires.
- Annual and multi-year contracts, divided by their term. A $12,000 annual deal is $1,000 a month for twelve months; a three-year deal is divided by 36.
- Recurring seats, add-ons and modules. Anything that bills every period alongside the subscription.
- Committed minimums on usage plans. The floor a customer has agreed to pay, not the variable spend above it.
What stays out
- One-time fees. Setup, onboarding, implementation, training, migration.
- Usage overages and credits. Report them on a separate usage revenue line.
- Taxes. VAT and sales tax belong to the tax authority, not to your run rate.
- Refunds, one-time credits and lifetime deals. They adjust an invoice, not a recurring value.
Edge cases confuse people most often. A free trial is not MRR until the first paid invoice lands; if it converts in May, it's new MRR in May. A grandfathered customer counts at the amount they're invoiced, not at today's list price. A paused subscription drops to zero while paused, and its resumption is either expansion or reactivation depending on how long the gap ran.
Why the KPI needs reconciling, not just calculating
MRR is an operating metric, not automatically GAAP revenue. PwC's software revenue recognition guide explains that SaaS arrangements with time-based performance obligations may recognize revenue ratably over the contract term, while MRR is a forward-looking run rate. Mid-month starts, service components and first-invoice discounts all make the two schedules diverge, so reconcile the KPI to your accounting schedules each quarter rather than assuming they agree.
The hygiene that makes this possible is boring and specific. Store, per subscription, the normalized recurring amount, currency, billing interval, effective start date, cancellation or pause date, plan and customer ID. Compute from the state of those records at one defined month-end timestamp, and never overwrite a prior month's figure. An overwritten number can't be audited, and a founder who can't explain last quarter's MRR has a credibility problem, not a spreadsheet problem.
The MRR Bridge from One Month to the Next
A single total tells you where you landed. The bridge tells you how you got there: beginning MRR + new business MRR + expansion MRR + reactivation MRR − contraction MRR − churned MRR = ending MRR. Stripe's guide to monthly recurring revenue argues for modelling MRR as a movement bridge rather than a single figure, because the decomposition works as a causal diagnostic: growth carried mainly by new customers can conceal weak retention, while expansion and reactivation show that the existing base is increasing its economic value.
The same logic produces net revenue retention on the starting cohort: (beginning MRR + expansion − contraction − churn) ÷ beginning MRR. Above 100%, the installed base grows without a single new logo. Below 100%, acquisition has to plug the leak before it can add anything.
Three months, walked through
| Month | New | Expansion | Reactivation | Contraction | Churned | MoM growth |
|---|---|---|---|---|---|---|
| March 2026 | +$1,200 | +$300 | $0 | -$150 | -$540 | +10.9% |
| April 2026 | +$600 | +$450 | +$120 | -$200 | -$780 | +2.3% |
| May 2026 | +$500 | +$600 | $0 | -$180 | -$300 | +7.3% |
March closes at $8,250 after $540 of churn, a 10.9% gain. Against benchmarks, that's unremarkable, since the same Stripe guide reports that early-stage SaaS companies commonly target roughly 10-20% MRR growth per month and that healthy B2B SaaS monthly churn commonly falls in the 0.5-7% range, with wide variation by segment and maturity.
April is the month worth staring at. It adds only $190, and not because nothing happened: $1,170 of gains were almost entirely erased by $780 of churn and $200 of contraction. April's NRR is 93.6% ((8,250 + 450 − 200 − 780) ÷ 8,250). Everything the month gained came from new logos while the base shrank, which is the pattern that ends badly if it repeats.
May recovers to $9,060, up 7.3% on $600 of expansion against $480 of contraction and churn. Same acquisition effort as April, better outcome, and the improvement is earned rather than bought. Work the row yourself: the ending figure is the check that your classification is complete.
The questions the bridge answers
- Is growth bought or earned? Compare new business MRR against expansion plus reactivation.
- Is churn accelerating? Two consecutive months of rising churn MRR matters more than any single growth number.
- Is expansion durable? Expansion from scheduled price rises looks very different from expansion from customers buying more seats because they're using the product more.
Publish the components and the cohort definition beside the total, so anyone reading the number can separate durable expansion from a promotional or acquisition-led spike. Then make it a monthly habit: build the bridge, and annotate the two largest movements with the specific customer and the reason behind each.
Reading Benchmarks With a Handful of Customers
A single cancellation can erase a month that looked fine on a percentage. Take twelve customers and $9,000 of MRR. The largest account is 40% of revenue, $3,600 a month, and it cancels. MRR falls to $5,400 in one event. A published median does not describe that loss, and quoting a strong retention figure at that moment does not tell you what to fix.
You lost one account. One customer carried too much of the total. Those two facts are what you act on.
Twelve customers works like a small class: one absence moves the average a lot. Two hundred customers works like a large class: one absence barely shows up. Early MRR percentages behave the same way, which is why the ranges below are context, not a grade.
| Metric | Healthy range | Notes |
|---|---|---|
| Monthly MRR growth (early stage) | Often faster than at scale, and very jumpy | A common ambition before product-market fit; one new logo can double the rate, and growth usually slows as the base gets larger |
| Monthly revenue churn (B2B SaaS) | Lower for enterprise, higher for SMB and consumer | Segment and maturity move this more than any single target |
| Net revenue retention (NRR) | Above 100% in stronger samples | Above 100% the existing base grows without new logos |
| Gross revenue retention (GRR) | A cited median in the low 90s for one bootstrapped sample | Excludes expansion, so upsells cannot flatter it |
| Top-customer share of MRR | Below 20-30% | Higher concentration makes growth and churn swing on one account |
The ranges are guardrails, not grades
A 2026 benchmark cited in ChargeOver's analysis of net revenue retention reports median NRR of 103% and gross revenue retention of 91% for bootstrapped B2B SaaS companies with $3 million to $20 million ARR. Other summaries of private B2B SaaS land on a different median, because they are not the same set of companies. Both readings can be true at once. Pick the closest segment, check the date on the figure, and use the range as a guardrail rather than a report card.
NRR can sit above 100% while you lose customers
Expansion from the accounts that stay offsets the ones that leave, so the retention percentage can improve while the logo count falls. Lose three small customers and upsell one large one, and NRR looks strong while the customer base shrinks. Read NRR next to gross revenue retention, and give logo churn its own line. Otherwise a rising retention rate hides a thinner book of customers.
Practical rule: once a single customer passes 20-30% of MRR, report the concentration and show the total both with and without that account.
What to publish instead of a percentage
Benchmarks get noisy when the sample is a handful of logos. Publish absolute movement:
- Customer count month over month, with the net direction spelled out.
- Logo churn and revenue churn in dollars, kept separate.
- Expansion dollars, split from new business.
- Top-customer concentration, plus the total with and without that account.
- Cohort retention by signup month, so a good month can be traced to the customers who caused it.
Pair the absolute figures with the wider set of SaaS metrics benchmarks when you want comparative context. Keep the raw movements in front of readers either way. One cancellation visible, and concentration disclosed, tells an early-stage backer more than a smooth line, because it separates repeat demand from one large account or one unusually good month.
When Usage-Based Pricing Distorts MRR
The assumption worth challenging is that rising MRR means the business is getting better. For a consumption-priced or hybrid product, that isn't reliably true. A study of consumption-based pricing from L.E.K. Consulting finds that 85% of SaaS companies already use, or are implementing, usage-based pricing, and traditional ARR and NRR become less dependable when revenue depends on variable consumption rather than a fixed subscription.
The question that sorts it out: what portion of this month's revenue is recurring, and what portion is volatile usage, credits, overages or one-time setup work?
Split the number into four layers
- Committed MRR. The platform fee or contracted minimum a customer owes whether they log in or not.
- Realized usage revenue. What consumption billed this month, reported on its own line.
- Expansion revenue. Deliberate upgrades, added seats and cross-sells, kept apart from usage drift.
- Non-recurring fees. Setup, migration and services, excluded from the run rate entirely.
Show a trailing three- or six-month view next to the current figure so a usage spike reads as an anomaly rather than a new baseline.
The AI version of the problem
For inference-heavy products, usage can grow faster than gross margin. Revenue climbs, token and compute costs climb faster, and MRR posts a record while unit economics deteriorate. Anyone evaluating a small SaaS business should therefore weigh MRR quality over MRR size: customer concentration, gross margin after variable costs, the recurring versus variable split, and whether usage holds after a launch or promotion ends.
Ask three questions before trusting a hybrid number: what share is contractually recurring, what happens to margin if usage doubles next month, and did usage hold once the launch week passed. Label the hybrid clearly on dashboards and traction pages instead of forcing it into one clean line, and read up on pricing model validation before you redesign the packaging around a number you can't yet interpret.
Set Up MRR Tracking and Share Verified Numbers
A rising MRR you cannot rebuild from the billing system is a story, not a number. Close the books the way a finance team closes a ledger: one source, one month-end cut-off, and no quiet edits after the month is done.
Work through the setup in this order.
- Pick one source of truth. Your billing system (Stripe, Paddle, Chargebee) is the right home because cancellations, failed payments and plan changes are recorded there as they happen. A spreadsheet can stand in while the customer list is still small, as long as the team treats that file as the only version.
- Store the subscription fields from the inclusion rules, so every active account has its normalized amount, currency, interval, dates, plan and customer ID.
- Snapshot at the same month-end timestamp every month, and keep an immutable history rather than editing old rows. A late refund or a failed payment belongs in a new correcting entry. Overwriting last month hides the churn you are trying to read.
- Reconcile quarterly against invoices or your accounting system, and write down any difference you cannot explain immediately. The right SaaS metrics software turns that comparison into a short check instead of a reconstruction from memory.
- Publish the movement next to the total, new, expansion and churn, so a higher ending figure still shows whether the growth was earned or bought.
Manual tracking gets you a defensible number. When that number has to stand in front of backers, Fundl connects to Stripe to display revenue and MRR, to GitHub for commit activity, and to analytics for audience size, then refreshes that data automatically so the page always shows the latest figures. Each project gets a shareable URL with the live metrics in one link, and setup takes about 15 minutes.
Compute this month's MRR from the snapshot, not from a dashboard you can still edit. Build the same split again next month. After three honest months you can see whether the increase survived failed payments, downgrades and a quiet week, and that pattern should shape pricing and retention work more than any single tile.
If you would rather show backers a live MRR figure than a screenshot, Fundl connects to your Stripe account and publishes verified revenue, commit activity and audience metrics on one shareable traction page that refreshes automatically. Set up your project and let the numbers make the pitch.