

A crowded dashboard doesn't prove SaaS traction. It can show signups, sessions, feature clicks, and a rising MAU line while leaving the essential question unanswered: are customers repeatedly getting enough value to keep using and paying for the product? Backers need a small set of metrics they can understand, verify, and connect to a real decision.
That matters in a market where SaaS is no longer a niche delivery model. Gartner's public cloud forecast estimated worldwide spending on cloud application services at $250.8 billion in 2024 and projected $299.1 billion for 2025, or 19.2% year-over-year growth (Gartner cloud application services forecast). The challenge for an early-stage founder isn't to match the market's scale. It's to show that actual product use supports the business story.
Table of Contents
- Why More Metrics Won't Prove Your SaaS Traction
- Understanding MAU, DAU, Session Length, and Feature Usage
- How Retention Curves Beat Single-Period Activity Counts
- Instrumenting Events That Count and Avoiding Vanity Counts
- Choosing the Right Denominator for Your Product Type
- Publishing Live, Source-Verified Metrics on a Traction Page
- A Compact Decision Matrix for Founders and Backers
Why More Metrics Won't Prove Your SaaS Traction
A long dashboard often creates more questions than confidence. A backer sees MAU, DAU, session length, feature usage, and signups, then has to guess which events count, who is included, and whether any of those numbers connect to paid demand. More instrumentation isn't the same as more proof.
There's a practical reason to resist tracking everything. A 2025 observability study found that just 13% of collected telemetry was actively used for monitoring, alerting, or troubleshooting, while 84% of companies used less than one-quarter of the data they collected (2025 observability study on telemetry use). For a small SaaS team, unused event data adds implementation and maintenance work without necessarily improving product decisions.
Show evidence, not dashboard volume
Start with the question a metric should answer. If you're deciding whether to improve onboarding, show whether new accounts reach a meaningful first outcome. If you're deciding whether the product has staying power, show cohort retention. If you're asking backers to fund continued development, connect usage to recurring revenue or another clear sign of paid demand.
A useful metric has a defined event, a stated denominator, a source, and a decision attached to it. A login count might help your team debug adoption patterns, but it's weak public evidence if users can sign in without completing valuable work. A completed workflow is harder to misread and more useful for deciding what to build next.
This is also why a public traction page should prioritize a handful of source-verified signals over an analytics wall. For teams thinking about how engagement signals are organized and communicated across platforms, this LinkedIn engagement platform guide offers relevant context on interpreting activity as more than a raw count.
Practical rule: If you can't explain what a metric changes about your next product, pricing, or funding decision, it probably doesn't belong at the top of your traction page.
Understanding MAU, DAU, Session Length, and Feature Usage
Four common SaaS usage metrics answer different questions. MAU tells you how many distinct users were active during a month. DAU counts distinct users active on a particular day. Session length estimates how long an active session lasts, while feature usage shows which parts of the product people use.
MAU is like counting everyone who walked into your store during the month. It measures reach, not repeat habit. DAU gives you a daily snapshot, but one day alone can be misleading. A product used for monthly reporting may provide substantial value even if customers don't open it every day.
Read frequency in context
The DAU/MAU ratio compares daily activity with monthly reach. If a product has 1,000 monthly active users and 200 daily active users, the ratio is 20%. That means the daily active count equals one-fifth of the monthly count, not that every individual user returns on one-fifth of the days. Cohort behavior can vary, so treat the ratio as a summary, not a user-level history.
A benchmark dataset covering more than 2,000 products reported a median DAU/MAU ratio of 13% for B2B SaaS overall and 25% for mission-critical B2B SaaS (B2B product metrics benchmark dataset). The gap is a reminder that workflow dependence affects frequency. Don't treat a product used for scheduled monthly work as though it should behave like a daily collaboration tool.
Session length can hint at depth, but longer isn't automatically better. A lengthy session might mean users are completing complex work, or it might mean they're stuck. Feature usage adds context: repeated use of an export, approval workflow, or integration may reveal more value than time spent in the interface. For broader help matching SaaS indicators to marketing decisions, see these fractional CMO insights on SaaS KPIs.
| Metric | What it measures | Best for answering |
|---|---|---|
| MAU | Distinct users active during a month | How broad is monthly adoption? |
| DAU | Distinct users active on a given day | How many users are active today? |
| DAU/MAU | Daily activity relative to monthly reach | How frequent is use in this product? |
| Session length | Time spent in an active session | How deep is an interaction, and is it productive? |
| Feature usage | Interaction with a defined product capability | Which product functions support real work? |
How Retention Curves Beat Single-Period Activity Counts
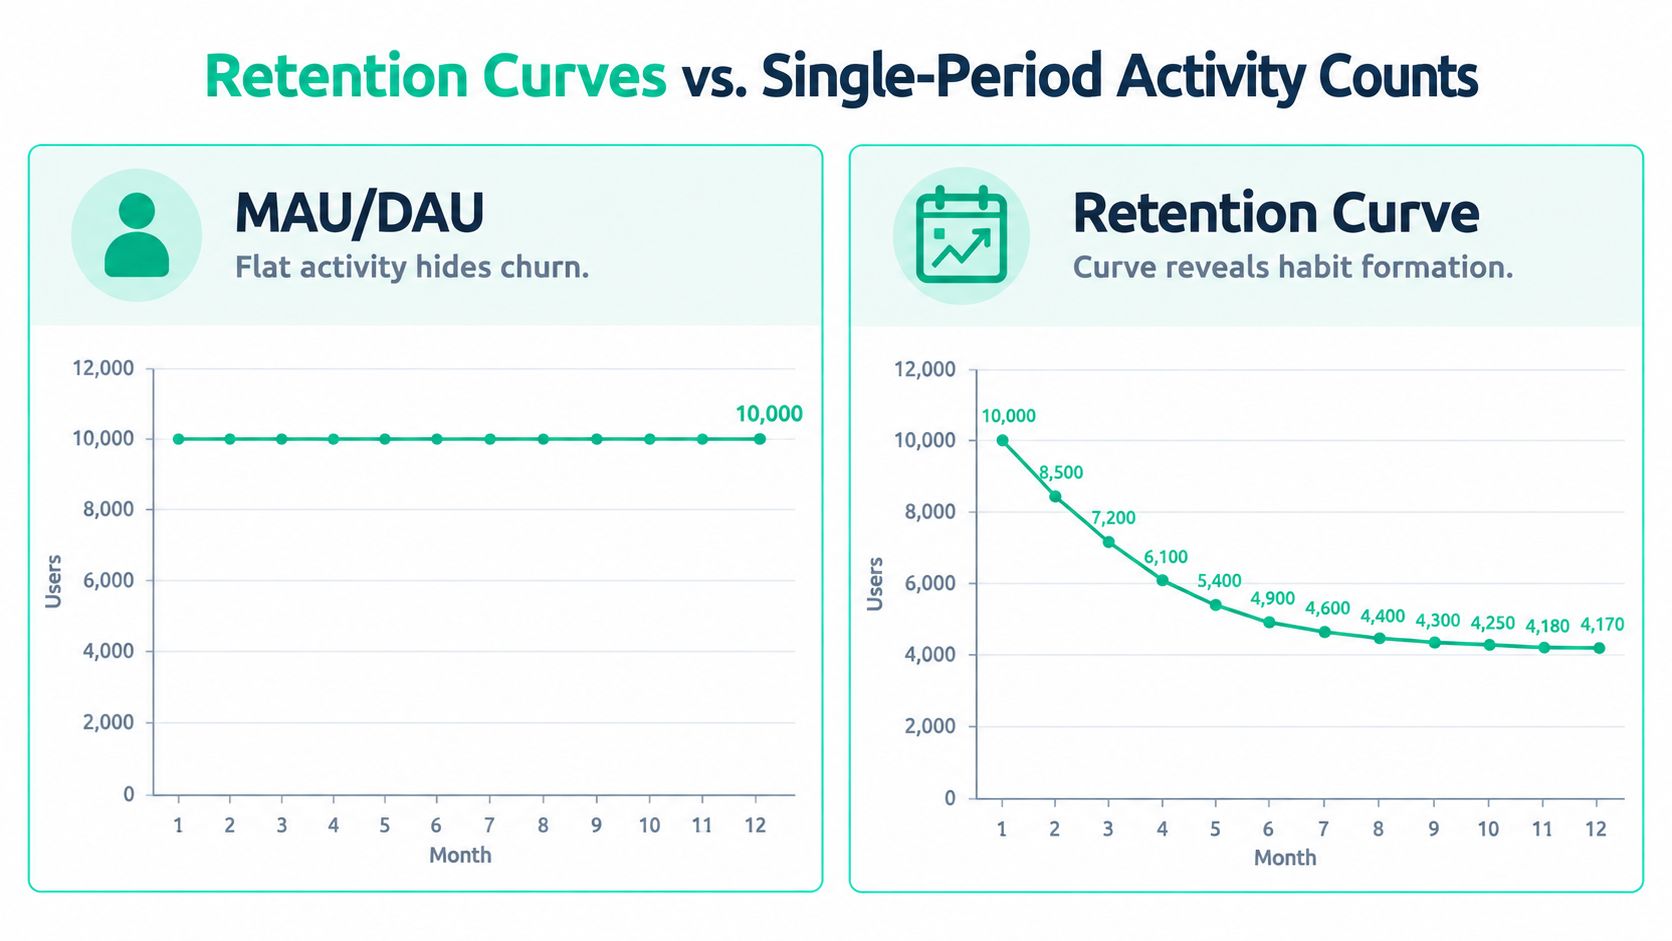
A single MAU figure can rise even while earlier customers disappear. New signups may replace users who have stopped returning, leaving the headline count stable while the underlying product experience weakens. Retention curves expose that movement by following the same cohort over time.
The compounding effect matters. At 95% monthly retention, about 54% of the original cohort remains after 12 months; at 90% monthly retention, the remaining share falls to about 28% (SaaS product analytics guide to retention). A small monthly difference can therefore produce a substantial gap in the share of users who continue over time.
Read the cohort, not just the headline
A cohort chart groups customers by a shared starting point, such as the month they signed up or first reached activation. Follow each group's return behavior through later periods. If newer cohorts retain better than older ones at the same point in their lifecycle, a product or onboarding change may be helping. If each curve drops sharply and keeps falling, more acquisition won't fix the underlying value problem.
Activation belongs in this analysis, but signup alone isn't activation. Define it as a predefined value event, such as completing a workflow or generating a first useful output. Then compare retention for accounts that reached that event with accounts that didn't. Make the activation window explicit and keep the event definition stable enough to compare cohorts fairly.
“Good churn” is a tempting phrase, but it can disguise a weak measurement choice. Some users may never be a fit, yet a founder should still identify which cohort or use case is leaving and why before treating that loss as harmless. A retention benchmark is useful for context, not a substitute for knowing how the comparison group defines customers and periods. For additional perspective, consult these benchmarks for retention rates.
For a traction page, cohort retention helps a backer judge whether current activity is likely to persist rather than merely whether the product had a busy month. The distinction between a total and a cohort view is covered further in this guide to customer retention metrics.
Instrumenting Events That Count and Avoiding Vanity Counts
A metric is only as defensible as the event behind it. If one team counts a page load as activity and another counts a completed task, their MAU figures don't represent the same behavior. Set an event taxonomy before you publish numbers, and use names that describe an action a person took, not a vague technical signal.
Define value events first
Choose events that show progress toward a customer outcome. In a project tool, that might be creating a project and completing a core task. In a data product, it could be running a successful query or exporting a report. In a workflow product, completing an approval or sending a first paying action may be more meaningful than opening the application.
Then define the population and time window. Does an active user mean any signed-in person, a paying seat, or an account member who completes a qualifying action? Does activation occur during an onboarding window or at any point after signup? These definitions determine what the number can support.
- Use logins as diagnostics: They're easy to collect, but they can count users who aren't getting value.
- Use workflow events as evidence: A completed action is more closely tied to product utility, provided the event is tracked consistently.
- Separate cohorts: Compare plans, acquisition channels, company sizes, or roles when those groups have different reasons to use the product.
- Keep internal signals internal: Error events and low-level navigation can help the team improve the product without belonging on a public traction page.
A signup may be followed by onboarding completion, a first value event, repeat core action, and eventual retention. Tracking that sequence helps locate the point where users stall. It also stops a high login count from hiding weak activation.
Keep the definition visible: Backers shouldn't have to guess whether “active” means logged in, invited a teammate, or completed meaningful work.
When analytics definitions drift, even a technically correct dashboard can mislead. Document event names, cohort rules, and known limitations, then review them when the product changes. This guide to improving data accuracy can help teams think through the practices that make published metrics more reliable.
Choosing the Right Denominator for Your Product Type
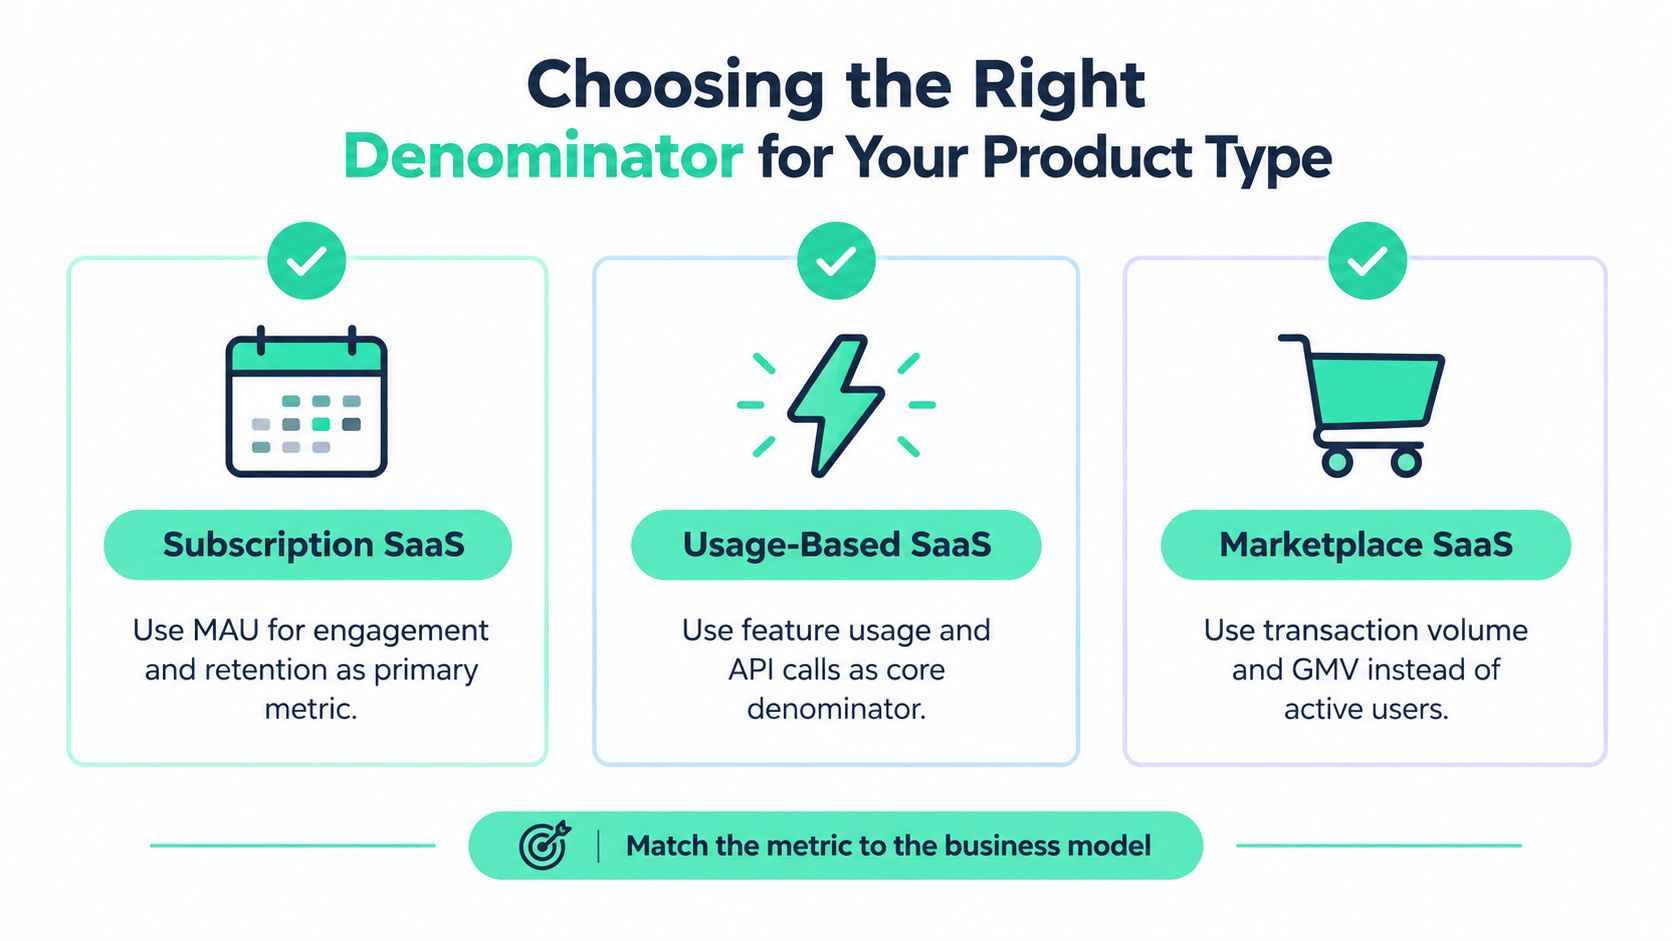
A user isn't always the right unit of value. In a seat-based SaaS product, account activity may be useful, but the number of active seats can reveal whether adoption has spread inside a customer. In an AI product, usage may arrive in bursts around a task or project. For a developer tool, a small group of engineers may create meaningful technical activity without daily visits from every account member.
Match the unit to how value is delivered
For traditional subscription SaaS, MAU can describe reach while account or user retention shows whether customers keep using the service. For AI tools, requests, completed tasks, or generated outputs may be more revealing than daily logins, especially when customer demand is project-based. Pair those activity measures with revenue behavior so a temporary spike doesn't get mistaken for durable demand.
Usage-based pricing calls for a closer link between consumption and economics. A 2025 SaaS benchmark reported gross revenue retention of 92% for usage-based pricing, compared with 88% for subscription and hybrid models, and found that 85% of companies had adopted or were testing usage-based pricing (2025 SaaS benchmark on usage-based pricing). Those figures describe the benchmark, not a guarantee for an individual product. A founder still needs to show whether a request, seat, workflow, or account predicts revenue and ongoing customer value.
Developer products may need measures such as successful builds, integrations, commits, or API activity, depending on the product's role in the development process. Open-source projects often need community contribution and adoption signals alongside paid conversions, since usage can precede monetization. A marketplace may need transactions or other exchange activity rather than treating every visitor as equivalent to a participant.
Before publishing a denominator, ask:
- What counts as value? Choose an action closely related to the product's core job.
- Who counts? State whether the unit is an account, seat, user, request, workflow, or transaction.
- Which users are included? Separate free activity from paid use where that distinction changes the interpretation.
- What business outcome follows? Connect usage to retention, expansion, support demands, or infrastructure costs.
Publishing Live, Source-Verified Metrics on a Traction Page
A number that can't be refreshed or traced back to a source is a weak public claim. Screenshots can become stale; a live connection can show what's happening now, provided the page also makes the metric's meaning clear. For backers, freshness and provenance are part of the evidence, not decorative dashboard details.

Make each number auditable
Connect the metric to the system that records it. Billing data can support recurring revenue claims; product analytics can support MAU or activation; a developer activity source can show shipping cadence. Don't imply that one data source proves something it doesn't. Usage data can show behavior, while billing data supports payment claims.
Put a short definition beside each public figure: the source, the denominator, the qualifying event, the cohort or period, and the refresh cadence. Disclose limitations too. For example, a metric may cover paid accounts only, exclude internal testers, or depend on an event that was introduced after earlier cohorts began.
Cloud software adoption is broad, but that doesn't make every adoption figure proof of an individual product's traction. Eurostat data for 2025 found that 52.7% of EU enterprises used paid cloud-computing services, an increase of 7.4 percentage points from 2023 (Eurostat cloud-computing adoption data summary). That broader context helps frame the market, while a traction page must still establish its own usage definitions and evidence.
A reliable publishing checklist is practical:
- Name the source: State which connected system supplies the number.
- Define the event: Explain what action qualifies as activity.
- Declare the denominator: Identify the user, account, seat, request, or other unit.
- Set a refresh cadence: Use a schedule the integration can sustain.
- Disclose limitations: Flag exclusions, gaps, or changes to the tracking definition.
A dashboard is useful only if backers can interpret the figures without a private walkthrough. Teams planning a public display can use this guide to a real-time metrics dashboard as a reference for presenting current evidence clearly.
A Compact Decision Matrix for Founders and Backers
A strong public traction page doesn't need every chart a product team uses internally. It needs enough evidence to support decisions about pricing, roadmap priorities, retention interventions, and funding credibility. The right metric depends on the decision and on whether a backer can interpret it without guessing at its definition.
| Metric | Decision it informs | Publish publicly? |
|---|---|---|
| MAU | Whether adoption is broadening | Yes, with the active-user definition and period |
| DAU/MAU | Whether activity frequency fits the product's workflow | Yes, when daily use is relevant |
| Session length | Whether interactions may be deep or friction-heavy | Usually internal, unless paired with clear context |
| Feature usage | Which capabilities users rely on and what to prioritize | Selectively, with the feature and eligible users defined |
| Activation | Whether new accounts reach a meaningful first outcome | Yes, with the event and activation window |
| Cohort retention | Whether usage continues after adoption | Yes, with cohort rules and elapsed period stated |
| Recurring revenue | Whether demand converts into ongoing paid business | Yes, with the source and revenue definition |
Public numbers earn credibility when they let backers verify the underlying claim. Before publishing, check that the event is defined, the cohort and denominator are stated, the source is named, the refresh cadence is clear, and any known limitation is disclosed. Keep metrics that change a decision. Leave vanity counts and operational noise in the private dashboard.
Fundl lets creators connect Stripe, GitHub, and analytics to publish a shareable traction page with live, source-verified signals such as recurring revenue, commits, and active users. If you're building a SaaS product and want backers to assess current evidence rather than stale screenshots, visit Fundl to create a traction page and raise support on your terms.