

If you're updating a traction page before sending it to investors or backers, you probably know the feeling. Stripe says one thing. Your internal dashboard says another. GitHub activity looks healthy, but your analytics tool is missing a chunk of user events, and suddenly the number you were about to publish doesn't feel safe anymore.
That moment is usually framed as a reporting issue. It isn't. It's a credibility issue. When a public metric is wrong, stale, or impossible to reconcile, people stop trusting the rest of the story too. That's why learning how to improve data accuracy matters far more for fundraising than most founders realize.
Table of Contents
- The Night Your Numbers Stop Being Believable
- Diagnose Where Your Accuracy Actually Breaks
- Build Instrumentation and Data Contracts That Hold
- Choose the Right Source for Each Metric
- Automate Tests, Reconciliation, and Monitoring
- Set Up Lightweight Governance That Sticks
- Keep Your Traction Page Honest Over Time
The Night Your Numbers Stop Being Believable
It usually happens late.
An investor asks for your latest MRR before a call. You open Stripe at night, refresh the dashboard, and see one number. Then you open the warehouse dashboard your team has been using internally and see a different one. Neither looks obviously broken. Both look plausible. That's the worst version of the problem.
If the gap were absurd, you'd catch it instantly. But when the difference is small enough to feel explainable and large enough to matter, you start guessing. Maybe one view includes annual plans normalized monthly. Maybe refunds haven't landed yet. Maybe a failed webhook skipped a downgrade. Maybe someone changed the SQL a week ago and never told anyone.
Meanwhile, your traction page still shows last month's metric. A backer bookmarked it. Another investor may have screenshotted it. Now there are multiple versions of your company floating around, each with a different answer to a simple question: what is true right now?
Practical rule: If you can't defend a metric line by line, you shouldn't publish it.
Founders often treat this as a tooling gap. Buy a better BI tool. Add one more dashboard. Pipe more events into the warehouse. That usually creates cleaner-looking confusion, not accuracy.
The problem is that public metrics sit at the end of a chain of decisions. Someone defined MRR one way in Stripe, another way in SQL, and a third way in analytics. Someone let timezone defaults ride. Someone counted upgrades twice because billing and product events both fired. By the time the number reaches a traction page, the error already has history.
The fix is a repeatable discipline. You need a way to make every published metric defensible, current, and traceable to a source you can explain under scrutiny. When that system exists, the next late-night scramble becomes a quick verification step instead of a negotiation risk.
Diagnose Where Your Accuracy Actually Breaks
Most early-stage teams don't have one data accuracy problem. They have four smaller ones hiding in different systems. The fastest way to find them is to stop staring at the final dashboard and trace each metric backward.
Start with the failure patterns
These are the places where founder metrics usually drift first.
| Failure type | Symptom in dashboard | First place to look |
|---|---|---|
| Definition drift | Stripe MRR and warehouse MRR both look reasonable but never match | Metric definition doc, billing SQL, dashboard calculation |
| Missing events | Signups look fine but renewals, refunds, or downgrades seem delayed or absent | Webhook handlers, retry logs, event ingestion jobs |
| Double counts | Revenue jumps after plan changes or upgrades without a matching cash event | Billing joins, duplicate event firing, client and server event overlap |
| Time-zone mismatches | Day, week, or month totals change depending on which dashboard you open | Warehouse timezone settings, source system timestamps, report window logic |
A lot of "bad data" is really bad agreement. One system isn't wrong in isolation. Two systems are answering slightly different questions.
Definition drift breaks trust first
This is the most common one. Stripe may define recurring revenue using billing objects and invoice timing, while your SQL model may rebuild MRR from subscription rows and line items. Both can be internally consistent and still disagree.
That matters because founders often compare tools as if they should align automatically. They won't. If your traction page says MRR, someone has to decide whether it includes discounts, paused plans, credits, delinquent accounts, and annual contracts translated into monthly terms.
A similar problem shows up in product metrics. MAU can mean users who logged in, users who triggered a specific event, or users with an active session in a rolling window. Three dashboards can produce three honest but incompatible answers.
Missing and duplicated events are quieter
Webhook gaps and duplicate instrumentation don't announce themselves. They leak into reports gradually.
Look for these clues:
- Refunds missing from public revenue views because the billing source captured them but analytics never did.
- Downgrades arriving late because retries succeeded in one system and failed in another.
- Upgrade events counted twice because both client SDKs and backend jobs emitted the same state change.
- Signup totals that exceed paying accounts because analytics tracked intent while Stripe tracked successful payment.
When a dashboard feels "mostly right," inspect the exceptions first. Accuracy usually breaks in refunds, retries, reactivations, and plan changes.
If you're also tightening conversion reporting, the same discipline applies to funnel metrics. A pageview, signup, activation, and payment event need stable definitions, or your optimization work turns into storytelling. The same problem shows up in revenue and conversion systems, which is why a clean diagnostic habit improves both. See this guide to improving conversion rates through that same lens.
The right order is simple. Reconcile the source of truth first. Then follow the divergence outward into the warehouse, dashboards, and product events.
Build Instrumentation and Data Contracts That Hold
The break usually happens before the dashboard exists.
A founder asks to put MRR, active users, and shipping velocity on a live traction page for investors. Someone pulls Stripe into the warehouse, someone else pipes in product events, GitHub data lands through another connector, and the numbers look fine until a board member asks why the public MRR disagrees with finance by a few percentage points. At that point, the problem is rarely chart design. The problem is that nobody locked the definitions, event rules, or ownership before publishing.
Write the contract before you trust the chart
A data contract for founder metrics can be simple. It should still be specific enough that another person can reproduce the number without guessing.
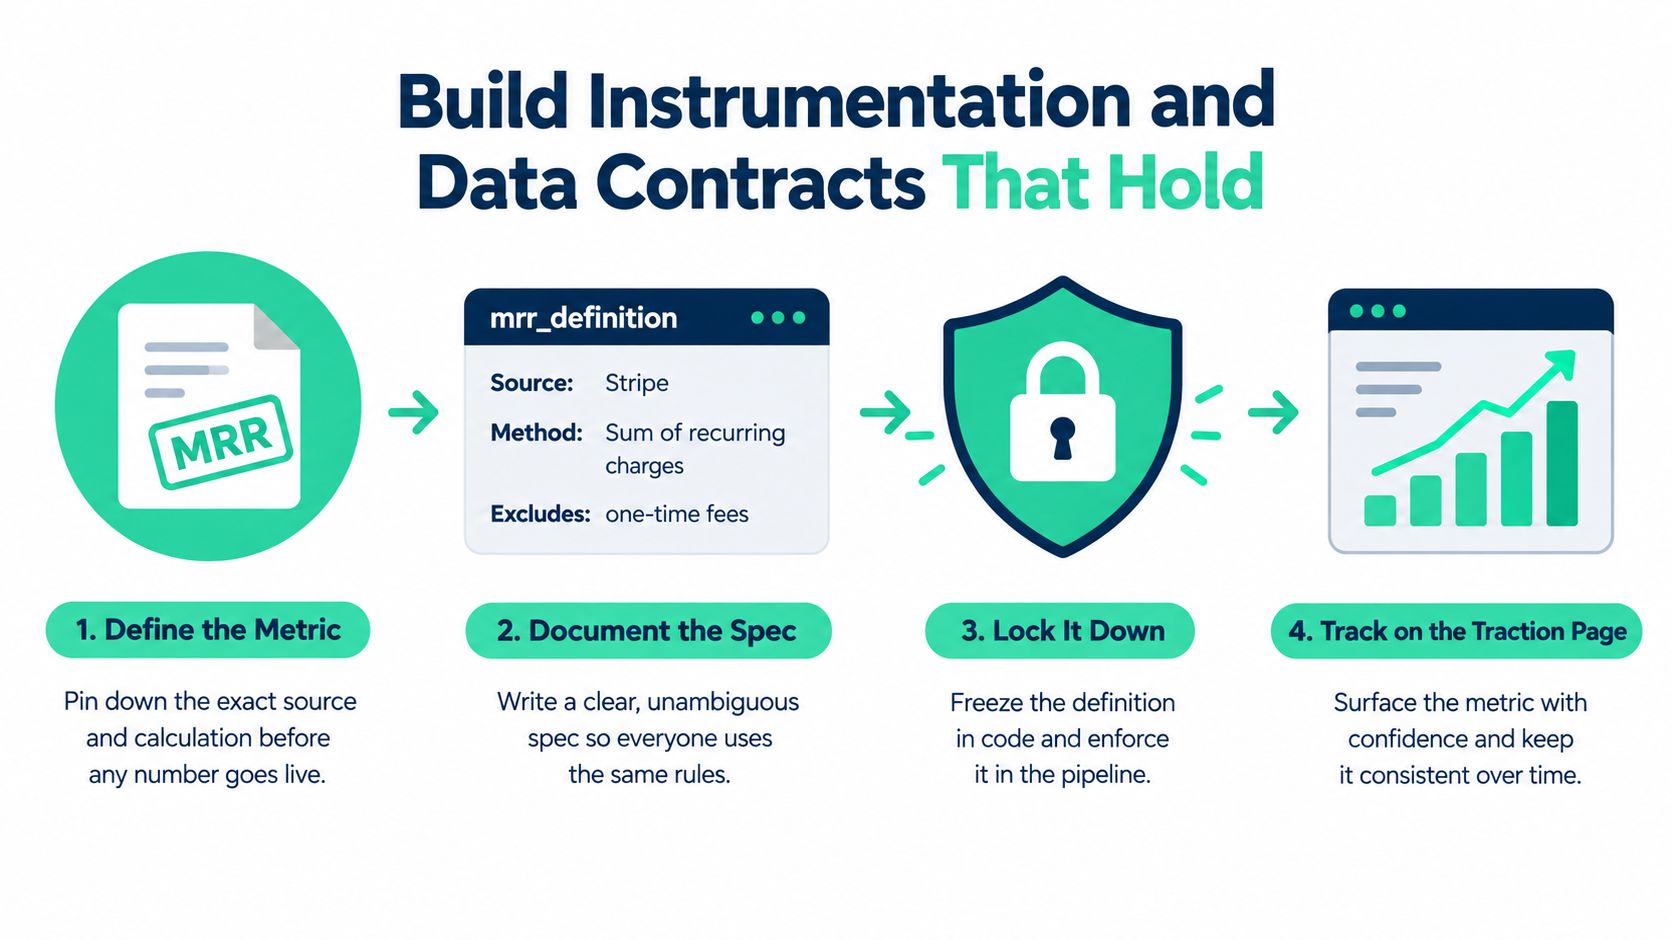
For MRR, that means more than saying "Stripe is the source." The contract should define which subscription states count, how annual plans are normalized, whether credits reduce recognized MRR, how discounts are treated, what timezone closes the month, and which query or API path drives the published value. If you plan to show the number to backers on a live page, this level of detail is the difference between a metric you can defend and one you have to explain away.
The same discipline applies outside revenue. A weekly commits contract should state whether the metric uses authored commits or merged commits, whether only the default branch counts, whether bots are excluded, and how force-pushes or rebases affect totals. For MAU, the contract should lock the qualifying event, identity rule, rolling window, and bot filtering logic. If those choices stay informal, teams keep shipping "small" instrumentation changes that rewrite history.
Put the contract where changes already happen
Version control beats a wiki for this work.
A YAML file, schema file, or short markdown spec in the repo does two useful things. It routes metric changes through pull requests, and it leaves a visible record of who changed the definition and why. That matters during fundraising. If an investor asks why your active user number changed in March, you want a commit history, not a Slack thread.
Include fields like these:
- Metric name with a stable identifier
- Owner who approves definition changes
- System of record such as Stripe, GitHub, or your product analytics platform
- Inclusions and exclusions written in plain language
- Time window with timezone and refresh cadence
- Identity rule for users, accounts, or organizations
- Query or endpoint reference so the implementation can be inspected
- Public display rule if the metric appears on a traction page
One sentence in the contract saves hours later: "This metric is approved for external display only if it reconciles to the source system within the accepted threshold." That forces a real discussion about tolerance. For MRR, a few cents of rounding drift may be acceptable. A refund gap is not.
Clean charts don't create trust. Shared definitions do.
Instrumentation also needs guardrails at the event level. Track important business events once, from the system that observed them. If both the client and backend emit "subscription_upgraded," duplication becomes a policy problem, not just a cleanup problem. Add required properties, set naming rules, and fail builds when those fields go missing. Teams usually resist this because it feels slower. It is slower for a week. It is much faster than explaining inflated MRR during diligence.
Research on data cleaning backs up the practical pattern you end up using. The REIN benchmark compares error-detection and repair methods across detection, repair, predictive accuracy, resilience, and scalability, and found meaningful differences in both quality and runtime across approaches (REIN benchmark findings). For an early-stage team, the takeaway is simple. Detect suspect records, test the repair logic, and verify the repaired output against the metric you publish.
If you want a quick visual walkthrough of how to turn metric definitions into something publishable, this breakdown is useful:
One practical option in this category is Fundl, which connects source systems like Stripe, GitHub, and analytics so published traction metrics come from authenticated sources rather than manually updated screenshots.
Choose the Right Source for Each Metric
The cleanest metric often comes from the system that created the underlying event. Problems start when teams force one tool to answer questions it wasn't built to own.
Use the source closest to the event
Stripe should usually own revenue truth. GitHub should own engineering activity. Product analytics should own behavior inside the app. That doesn't mean those systems are complete for every purpose. It means they are the best starting point for the public metric tied to that domain.
Here's the simple map most founder teams need:
| Metric | Best Source | Watch Out For |
|---|---|---|
| MRR | Stripe | Treatment of refunds, discounts, annual plans, failed charges |
| Paying accounts | Stripe | Multiple subscriptions per customer, paused accounts, credits |
| MAU | Product analytics | Event definition drift, anonymous users, bot traffic |
| Weekly active users | Product analytics | Rolling window confusion, timezone mismatch |
| Weekly commits | GitHub | Bot commits, force-push effects, branch scope |
| Deploy frequency | GitHub or deployment system | Squashed merges, rebases, non-production deploys |
Where systems usually disagree
Stripe may exclude failed charges that an analytics setup still counts as a "converted" user because the signup event fired before payment settled. GitHub may compress activity in ways that don't match how your team talks about shipping. Product analytics may miss a refund entirely because the refund happened in billing, not in-app.
Those disagreements aren't bugs by default. They're reminders that each tool answers a different operational question.
A founder can easily pull three MAU numbers in one afternoon. One comes from the analytics home screen. Another comes from a custom SQL model that filters internal users differently. A third comes from CRM activity tied to lifecycle stages. The right response isn't to average them. It's to choose one system to own public MAU, then document the filters and exclusions.
Joining sources needs explicit rules
Sometimes a published metric has to combine systems. A traction page might pair Stripe paying accounts with product analytics activation rate, or compare GitHub shipping activity against usage.
When you join systems:
- Keep one owner per metric. The join can enrich context, but one source should still determine the final number.
- Normalize identity carefully. Customer IDs, user IDs, and email-based joins are where hidden mismatches begin.
- Document refresh timing. A source updated now and a source updated later can create fake deltas.
If the number is public, assign ownership on the page itself or in the metric spec behind it. That way, when someone asks where a metric came from, the answer is immediate.
Automate Tests, Reconciliation, and Monitoring
Manual spot checks work once. They don't hold through a launch, a pricing change, or a fundraising sprint. If you want numbers that survive scrutiny, you need small automated checks that catch drift before anyone external sees it.
Start with tests that fail loudly
The cheapest useful layer is schema testing in your warehouse or transformation pipeline. If an event property changes shape, disappears, or starts arriving with nulls in a critical field, the pipeline should complain immediately.
Good starter tests for founder metrics include:
- Required field tests for subscription IDs, customer IDs, event timestamps, and plan identifiers
- Uniqueness checks on records that should never duplicate, such as billing event IDs
- Accepted value tests for plan types, billing status, and environment flags
- Freshness checks to catch a source that stopped syncing
Named ownership matters here. If no one is responsible for an alert, the alert becomes decoration within a sprint.
Reconcile systems every day
You don't need enterprise complexity. You need a lightweight script that compares the core answers from different systems and flags mismatches for review.
A practical cadence looks like this:
- Pull revenue truth from Stripe.
- Pull paying-user and activation counts from analytics or the warehouse.
- Compare by the same date window and timezone.
- Review any variance against the metric contract.
You can do this with plain SQL and a scheduled job. For example, run a duplicate check against subscription identifiers, a null check against customer joins, and a date-window check for conversions landing on the wrong day because one system logs in UTC while another is viewed in local time.
A few useful query patterns:
- Duplicate subscriptions by grouping on subscription ID and looking for repeated active rows
- Missing customer links by finding paid billing records without a matching internal account
- Timezone slips by comparing event counts around day boundaries in source time and reporting time
A reconciliation script is less about "fixing data" and more about proving that your published metric still has a defendable path back to reality.
There's good evidence that hybrid cleaning works better than rules alone when data quality gets messy. One large-scale study across four heterogeneous datasets reported mean residual error of 10.5% for an ML-orchestrated cleaning framework versus 17.1% for rule-based cleaning and 13.2% for BoostClean, alongside downstream classification accuracy of 0.842 after cleaning compared with 0.790 for rule-based and 0.824 for BoostClean (hybrid cleaning study). For small teams, that translates into a practical workflow: combine statistical checks, model-assisted repair where useful, then manually audit a sample before trusting the output.
Monitor the boring signals
Teams over-monitor dashboards and under-monitor pipelines. You need alerts for conditions that usually precede a bad public number.
Useful examples:
- Event disappearance alerts when a critical tracked event stops arriving
- Volume anomaly alerts when signups, subscriptions, or usage events drop sharply relative to recent patterns
- Refresh lag alerts when a source hasn't updated within its expected window
- Metric mismatch alerts when two systems that usually align begin to diverge
Make these alerts narrow and actionable. "Revenue changed" is noise. "Refund records missing from the daily billing sync" is actionable.
Run a pre-publish checklist
Before you update a traction page, verify:
- Source freshness so the upstream system has updated
- Contract alignment so the number still matches the latest metric definition
- Reconciliation status so major systems don't disagree unexpectedly
- Exception review for refunds, reactivations, downgrades, and edge cases
- Named sign-off from the owner of the metric
Small teams can maintain this. Large governance programs often collapse under their own ceremony. Tight checks with clear owners tend to survive.
Set Up Lightweight Governance That Sticks
Most cleanup efforts fail for a boring reason. The team fixes the metric once, everyone feels relief, and then normal product work resumes. A month later someone changes an event name, adjusts a pricing table, or edits a dashboard query, and the drift starts again.
Governance sounds corporate, but the useful version is tiny. It's just a set of habits that makes metric changes visible before they leak into public reporting.
Keep the role model simple
You don't need a committee. You need three owners.
- Metric owner for each public number. This person answers basic questions like what the metric means, where it comes from, and whether the latest value is publishable.
- Data reviewer who approves changes to definitions, queries, or transformations.
- Instrumentation lead who owns event naming and taxonomy so the product side doesn't mutate reporting accidentally.
These can be part-time roles on a small team. What matters is that they exist.
Use change control people will actually follow
The best workflow is the one that fits your current shipping rhythm. A pull request on the metric-definition repo, peer review, and a changelog entry is enough for most founder teams.
That same discipline becomes more important when your systems cross vendors and jurisdictions. If you're dealing with hosted analytics, payment data, or customer identifiers across environments, this practical data sovereignty guide is useful context for deciding who can move which data where, and why that affects trust in published metrics too.
If your team already creates investor-facing materials, treat metrics like you treat external docs. A number going on a traction page deserves the same review standard as a partnership proposal or sponsor one-pager. The workflow in this sample sponsorship proposal guide is different in subject matter, but the discipline is similar: define ownership, review before publishing, and keep a changelog.
The cheapest governance model that survives is the one attached to work your team already does.
Review anomalies, not dashboards
A weekly short meeting works better than a broad analytics review. Focus on what changed, what broke, and what needs re-verification.
Ask only a few questions:
- Did any public metric definition change?
- Did any source system miss its refresh window?
- Did reconciliation produce a mismatch worth investigating?
- Is any traction-page number due for re-verification before being shared again?
That cadence stops the slow erosion that makes founders sound uncertain when investors ask follow-up questions. Governance isn't a document. It's a repeated behavior.
Keep Your Traction Page Honest Over Time
A trustworthy traction page doesn't just look polished. It makes every number easy to defend.
That means a backer can click through and see metrics that are current, consistently defined, and refreshed from the right systems. It also means you can answer the uncomfortable follow-up instantly: when was this updated, from what source, and under what definition?
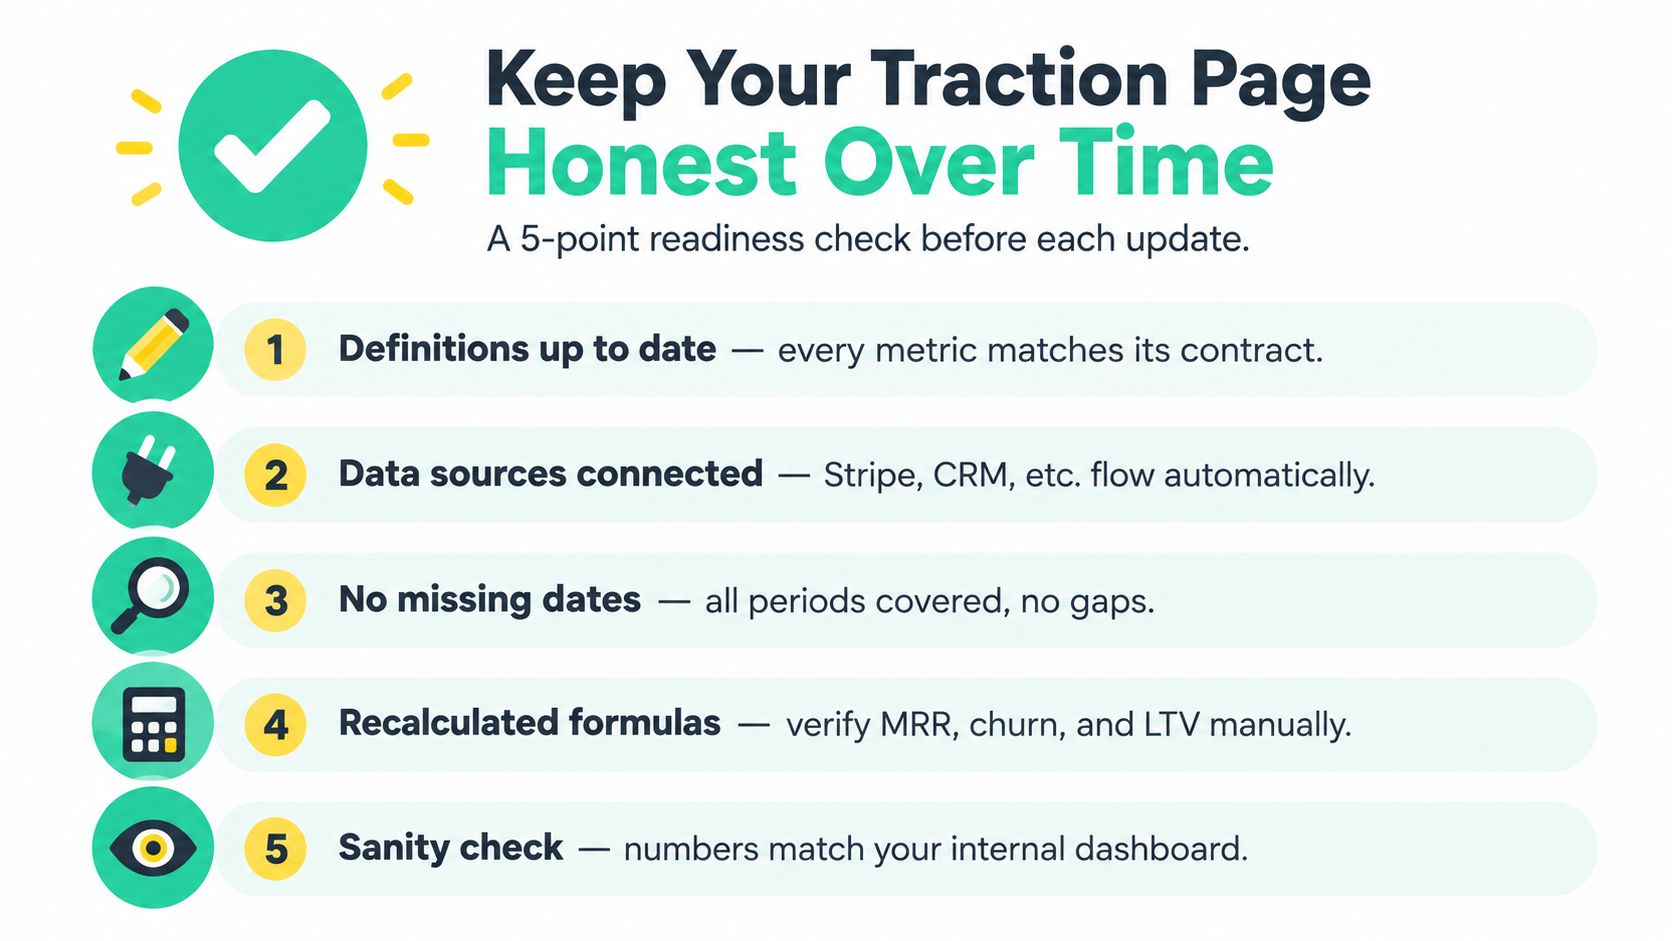
Run the same readiness check every time
Before each update, verify the basics:
- Definitions are current and still match the metric contract.
- Revenue comes from the billing source on the latest approved refresh.
- Churn and cohort metrics use the same fixed definition as prior updates so trends remain comparable.
- GitHub and analytics windows align when you present weekly engineering and user metrics side by side.
- Each metric has a visible refresh timestamp so viewers know how fresh the data is.
Treat publication as re-verification
This is the habit many groups miss. They calculate a number once, publish it, and mentally convert it into a static fact. Public metrics don't work that way.
A traction page is a live claim. If someone sees it today, the number needs to hold up today. That's especially important when you're using live proof as part of fundraising. If you're thinking about how investor-facing credibility and metric hygiene fit together, this breakdown of how to get startup funding gives useful context on what external readers are evaluating when they see traction.
A simple weekly ritual is enough. Re-run the reconciliations, review the exceptions, capture the verification output for your data room, and republish only what still checks out.
The teams that keep investor trust aren't the ones with perfect systems. They're the ones that treat every public metric like a promise that must be re-earned before it's shown again.
Fundl gives founders a way to publish traction using live, connected metrics instead of screenshots and manual updates. If you want Stripe, GitHub, and analytics numbers to stay credible in front of backers, it's worth seeing how Fundl turns source-verified data into a public traction page you can defend.