

The most popular advice about SaaS sales metrics is to find a benchmark, compare your dashboard, and close the gap. That's incomplete advice. A self-serve product and an enterprise platform can produce different results without either founder making the wrong decisions.
Most SaaS dashboards mix useful signals with decorative ones. Revenue totals look reassuring, but they don't explain whether customers stay, whether acquisition spending pays back, or whether the business can afford its next growth investment. The useful metric is the one that changes a decision.
Use Fypion Marketing's benchmarking insights as a starting point for thinking about comparisons, not as permission to apply universal targets. Before adopting a benchmark, match the customer segment, pricing model, measurement period, and metric definition.
A benchmark can help you ask a better question. It can't decide how much cash your business should risk.
A focused set of SaaS sales metrics should reveal whether new customers are worth acquiring, whether they keep paying, and whether growth can support durable cash flow. The ten metrics below connect those questions to specific founder decisions, from fixing onboarding to changing pricing or scaling acquisition.
Table of Contents
- 1. Monthly Recurring Revenue (MRR)
- 2. Annual Recurring Revenue (ARR)
- 3. Customer Churn Rate
- 4. Net Revenue Retention (NRR)
- 5. Customer Acquisition Cost (CAC)
- 6. Customer Lifetime Value (LTV)
- 7. LTV:CAC Ratio
- 8. CAC Payback Period
- 9. SaaS Magic Number
- 10. Trial-to-Paid Conversion Rate
- 10 Essential SaaS Sales Metrics Compared
- Build a Dashboard That Drives Decisions, Not Just Data
1. Monthly Recurring Revenue (MRR)
MRR measures the monthly value of active recurring subscriptions. Normalize longer billing periods into monthly amounts, and keep one-time implementation fees, consulting work, and other nonrecurring payments separate.
The operating decision is straightforward: what recurring revenue base should you use when planning spending? Don't answer it from the latest payment total alone. An annual subscription collected upfront affects cash differently from the monthly recurring value of that subscription.
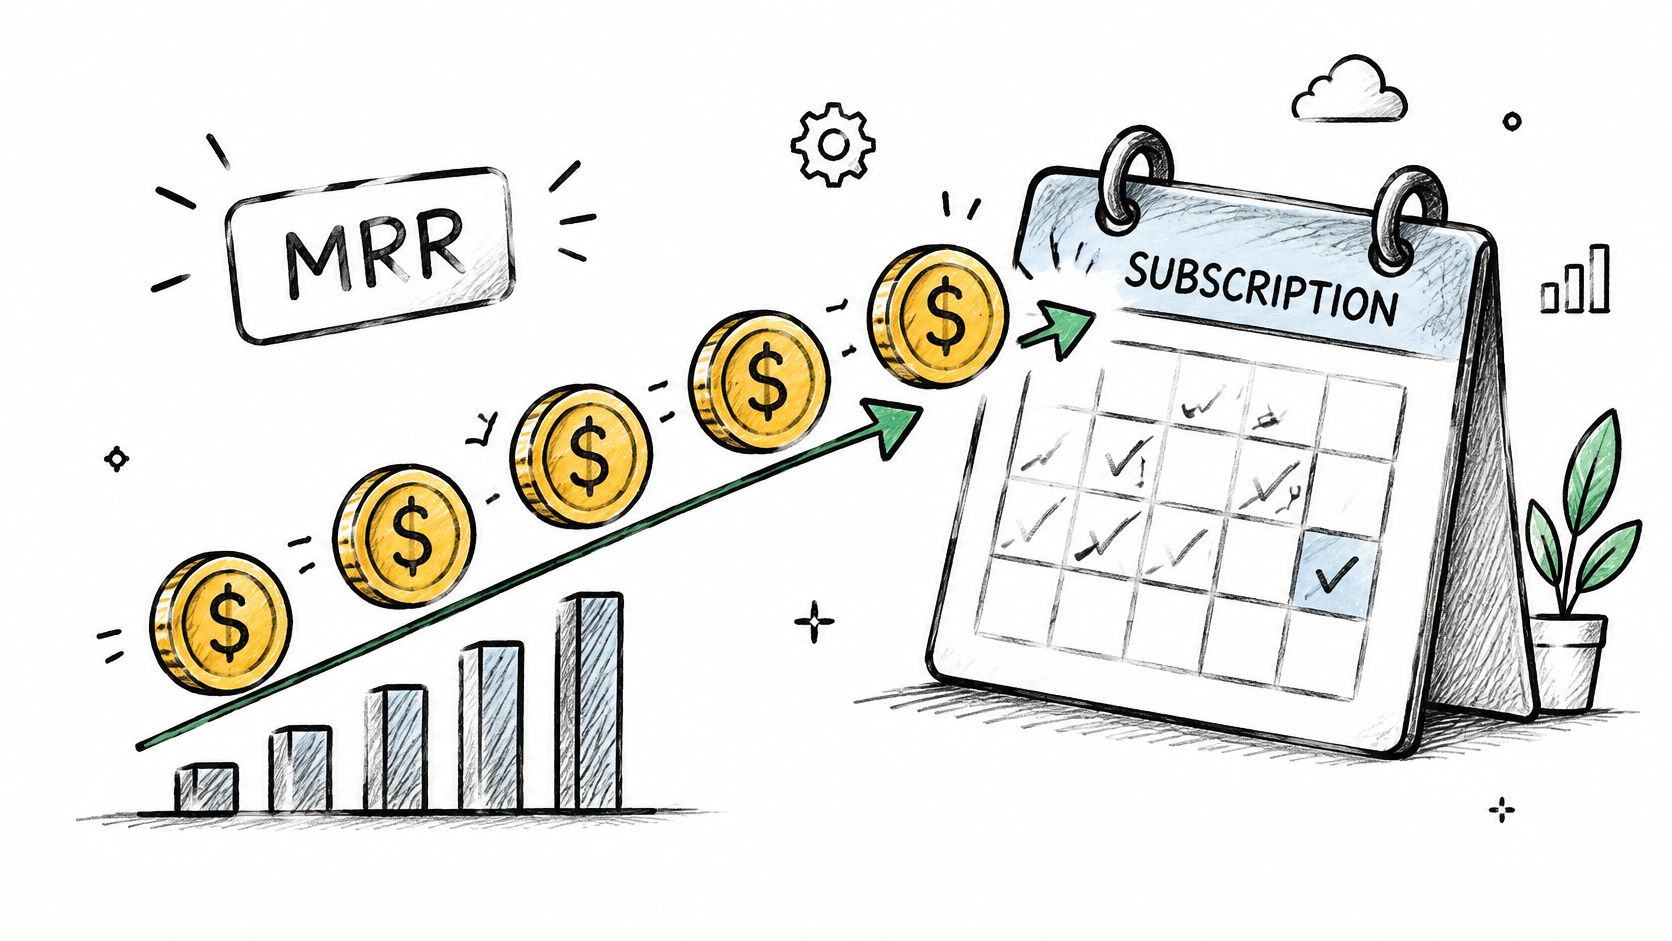
This illustration represents the recurring subscription pattern you're trying to measure.
Explain the movement, not just the total
Suppose your MRR rises while established customers downgrade. You might interpret the increase as permission to spend more, even though new sales are concealing weaker retention.
Break the change into distinct components:
- New MRR: Recurring revenue from newly paying customers.
- Expansion MRR: Additional recurring revenue from existing accounts.
- Contraction and churn: Revenue lost through downgrades and customer departures.
Document how you handle discounts, refunds, overdue accounts, and subscription cancellations. If your pricing includes variable usage, distinguish committed recurring charges from fluctuating consumption rather than presenting everything as equally predictable.
For practical comparisons, use SaaS metrics benchmarks alongside your own historical trend. Reconcile the underlying subscription records with Stripe and preserve your calculation rules, so a founder, analyst, or backer can understand both the number and its boundaries.
2. Annual Recurring Revenue (ARR)
A founder with growing annual subscriptions faces a communication problem: monthly collections don't neatly describe the recurring business. ARR expresses the current subscription base on an annualized basis, making it useful for discussing scale across different billing schedules.
Treat it as a run-rate measure, not a promise of future cash. Your current customers can still cancel, downgrade, expand, or renew on different terms.
Separate scale from certainty
Consider a founder negotiating a large contract while reporting an ARR milestone. Including the unsigned deal would combine existing traction with an expected outcome, leaving readers unable to distinguish what's operating from what's still being sold.
Keep those categories separate:
- Active recurring revenue: The subscription base included in your ARR definition.
- Contracted future business: Signed commitments that haven't entered the active base.
- Pipeline: Opportunities that may or may not close.
ARR also becomes less informative when you annualize an unusually strong usage period without explaining the assumption. For a consumption-based product, show the underlying usage trend and distinguish contractual commitments from variable spending.
Use ARR to communicate scale, then use retention and cash forecasts to judge its durability. If ARR grows because new customers replace departing ones, the operational response differs from growth driven by healthy customer expansion.
A credible ARR update therefore needs context: the measurement date, inclusion rules, customer concentration, and explanation of recent changes. Don't let a polished milestone replace the evidence needed to make a hiring or acquisition decision.
3. Customer Churn Rate
A customer leaving your entry plan and a major account cancelling create different financial problems. Customer churn counts lost customers; revenue churn measures lost recurring revenue. Track both rather than treating them as interchangeable.
For customer churn, compare departures during a defined period with the customers present at its beginning. Keep the period and customer eligibility rules consistent.
The illustration below shows customer losses as a separate operating signal.

Match the response to the reason
A failed payment calls for a different intervention from a customer who never completed setup. Use your billing records, cancellation feedback, and product activity to investigate the difference.
- Payment-related departures: Review retries, payment-update requests, and account recovery.
- Early voluntary cancellations: Examine onboarding, expectations, and acquisition source.
- Established-customer departures: Investigate changing requirements, pricing, reliability, and alternatives.
Suppose an acquisition campaign attracts customers who cancel soon after subscribing. Buying more traffic from that campaign may increase signups without producing durable demand. The more useful investment could be better targeting or clearer positioning.
Don't judge long-contract retention before customers have had a meaningful renewal opportunity. Likewise, a small customer base can produce volatile percentages, so publish the underlying customer counts alongside the rate.
Use the distinctions in SaaS retention metrics to keep your reporting interpretable. The founder decision is where to repair retention, not just whether the headline churn rate looks acceptable.
4. Net Revenue Retention (NRR)
NRR measures what happens to recurring revenue from an existing customer cohort, including expansion, contraction, and churn, but excluding newly acquired customers. It helps you decide whether to invest in customer expansion or repair losses before accelerating acquisition.
The image illustrates expansion within an existing revenue base.

An NRR of 100% means the cohort retained its starting revenue, while a higher result means expansion outweighed losses; the SaaS benchmark compilation reports 101% median NRR for the datasets it summarizes. That same compilation reports 102% median NRR for contracts with annual values between $25,000 and $50,000, with the top quartile at 111% and bottom quartile at 97%.
Identify what produced expansion
Suppose existing accounts spend more after a pricing change, but fewer people actively use the product. Your NRR may improve without providing equivalent evidence of deeper adoption.
Separate price increases, seat additions, usage growth, and reactivations. Pair NRR with gross revenue retention, which excludes expansion, so successful upsells don't conceal customer losses.
For operational follow-through, the customer success ops guide provides a related resource for organizing customer work. Assign responsibility for investigating downgrades and expansion opportunities rather than stopping at the report.
The following video provides an additional explanation of the metric.
5. Customer Acquisition Cost (CAC)
CAC measures acquisition spending per newly acquired paying customer. Its usefulness depends on whether you include the costs required to produce those customers, not just the advertising invoice.
For a solo founder, an apparently inexpensive organic channel may require substantial writing, distribution, and sales work. Show cash spending separately from an estimate of founder effort rather than describing unpaid labor as free acquisition.
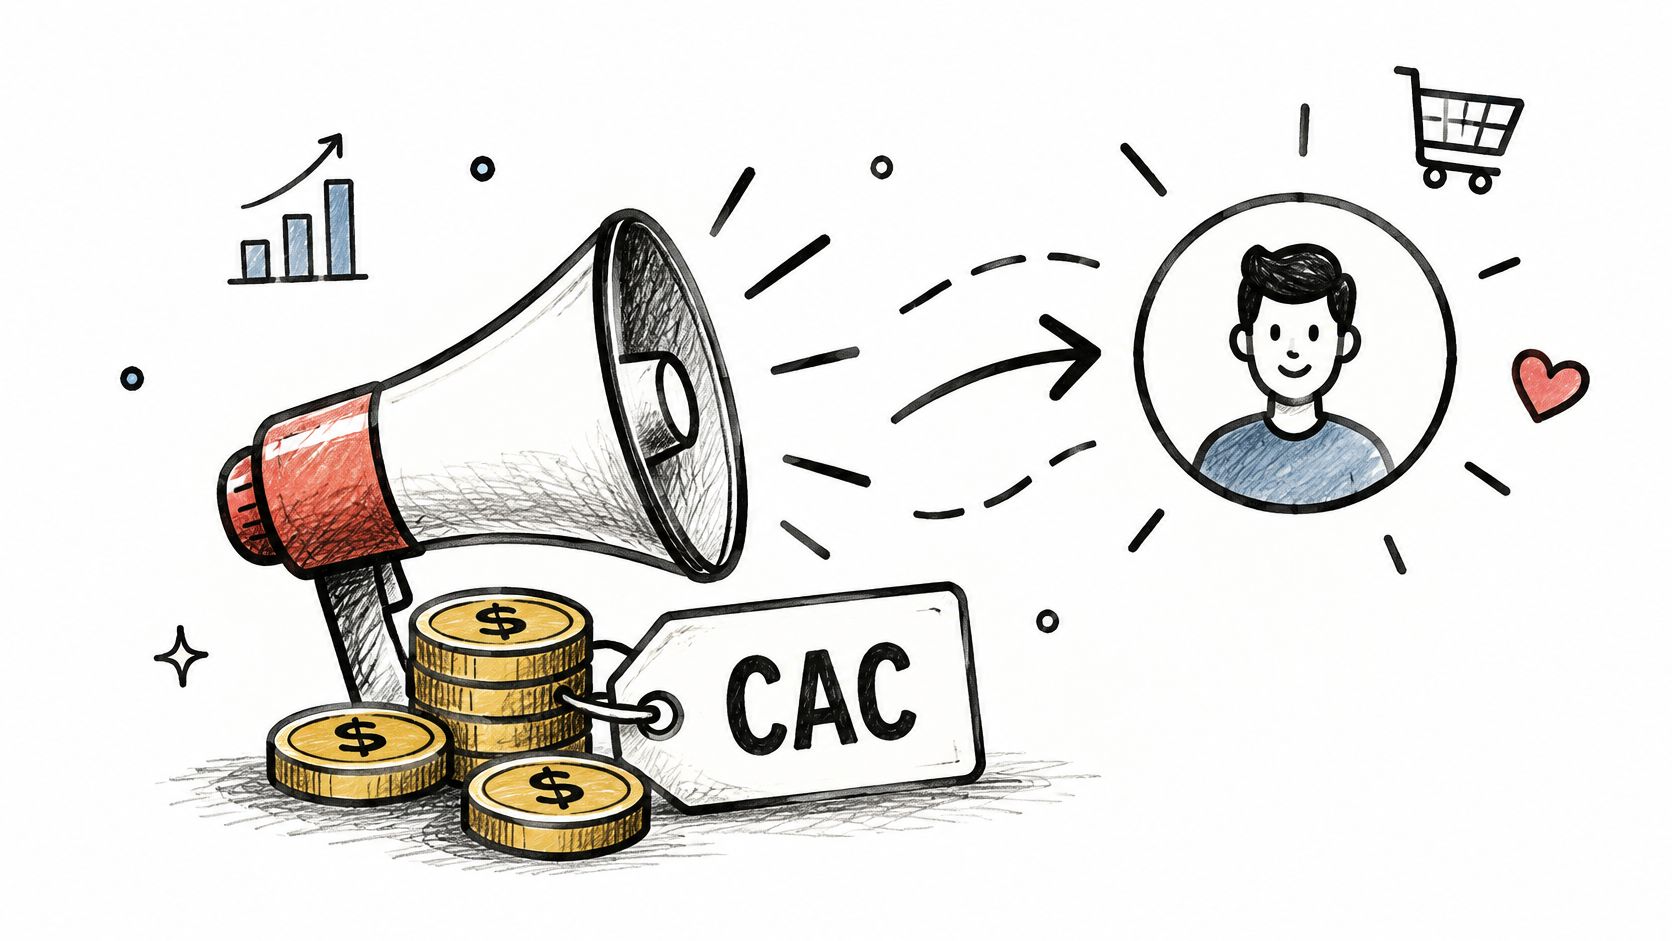
The illustration highlights the cost attached to acquiring a customer.
Allocate budget using comparable costs
Before comparing channels, establish consistent inclusion rules:
- People: Acquisition-related salaries, commissions, contractors, and founder effort.
- Programs: Advertising, content production, partnerships, and campaign expenses.
- Infrastructure: Relevant sales and marketing software and allocated acquisition overhead.
Consider a founder comparing paid search with partner referrals. If paid-search CAC includes agency fees but partnership CAC excludes relationship-management work, the comparison doesn't support a sound budget decision.
Timing matters too. Match acquisition spending to the customers it plausibly helped generate, allowing for the actual sales cycle rather than assuming spending and conversion happen together.
Use SaaS efficiency metrics to evaluate CAC alongside retention, gross margin, and recovery time. Lower CAC isn't automatically better if the cheaper channel attracts customers who leave quickly or require costly delivery.
Before scaling a channel, examine its acquired cohorts. The important question isn't what you paid to win them, but what happened after they started paying.
6. Customer Lifetime Value (LTV)
LTV estimates the value a customer may generate over the relationship. For acquisition decisions, use expected gross-profit contribution rather than revenue alone, and state which definition you've chosen.
Unlike recorded subscription revenue, lifetime value contains assumptions about the future. That distinction matters most when your customers haven't been around long enough to demonstrate the lifetime you're projecting.
Modeling discipline: Show realized customer value separately from the future value you expect.
A founder comparing pricing tiers might find that the premium plan produces more revenue but also requires substantial implementation and support. Promoting that plan solely because its subscription price is higher could overlook the cost of serving it.
Use assumptions you can defend
Build the estimate from customer revenue, delivery costs, observed retention, and plausible expansion. Keep different customer types separate when their behavior or service requirements differ.
- Limit the projection horizon: Don't assume indefinite retention because recent cancellations are scarce.
- Test downside assumptions: Examine what happens if retention weakens or delivery costs rise.
- Update after meaningful changes: Revisit the model when pricing, onboarding, or customer mix changes.
Avoid treating expansion as guaranteed because current NRR is encouraging. An account may add seats initially and later reach a natural ceiling.
Use LTV to compare investment options, not to manufacture spending permission. If a channel looks attractive only under optimistic retention assumptions, gather more cohort evidence before committing scarce cash to it.
7. LTV:CAC Ratio
An attractive lifetime-value estimate can make almost any acquisition budget look reasonable. The LTV:CAC ratio compares estimated customer value with acquisition cost, but it inherits the uncertainty and accounting choices in both inputs.
The founder decision is whether a customer segment appears economically worth pursuing. The ratio alone can't tell you whether you can afford to pursue it now.
Compare like with like
Suppose partner referrals retain well, while paid campaigns bring in less committed customers. Combining referral-driven LTV with blended acquisition costs could make the paid channel appear more attractive than its own customer outcomes justify.
Calculate the ratio using aligned cohorts and definitions:
- Matching customers: Compare acquisition costs with value from the customers those costs produced.
- Matching economics: Don't compare gross-profit LTV in one segment with revenue-based LTV in another.
- Visible uncertainty: Label projected retention and expansion rather than presenting them as observed results.
There's no need to impose a universal target to make the ratio actionable. Instead, ask whether the relationship remains attractive under conservative assumptions and whether it improves as cohorts mature.
A favorable lifetime ratio doesn't mean the customer repays acquisition costs before your cash runs out.
For example, a founder may reasonably choose a less impressive projected ratio with faster recovery over a more attractive long-term model that requires financing they don't have. Pair LTV:CAC with payback and runway, then decide how much uncertainty the business can absorb.
8. CAC Payback Period
CAC payback measures how long customer gross-profit contribution takes to recover acquisition cost. A practical calculation divides CAC by monthly average revenue per account multiplied by gross margin.
The B2B SaaS benchmark summary places median payback at approximately 20 months, with segment guidance of 6–12 months for product-led or SMB SaaS, 12–18 months for sales-led mid-market businesses, and 18–24 months for enterprise software. Treat those ranges as context, not spending authorization.
Translate efficiency into a cash decision
Suppose you can acquire a promising enterprise account, but implementation requires immediate spending and payment arrives later. Its projected economics may be attractive while the near-term cash requirement remains unacceptable.
Distinguish these questions:
- Economic recovery: When does cumulative gross profit cover acquisition cost?
- Cash collection: When does the customer pay?
- Funding capacity: Can the business support acquisition and delivery until recovery?
Annual prepayment can improve cash timing, but collecting cash upfront doesn't remove the obligation to deliver the service. Keep a cash forecast alongside the gross-margin-adjusted payback calculation.
For another benchmarking reference, consult payback period benchmarks for B2B, while preserving your own segment definitions.
Set acquisition budgets around a recovery period your runway can support. As noted earlier, retention changes the interpretation: fast initial recovery doesn't rescue poor customer durability, and strong expansion doesn't eliminate near-term financing needs.
9. SaaS Magic Number
The SaaS Magic Number compares annualized recurring-revenue growth with sales and marketing spending from a preceding period. It offers a company-level view of sales efficiency rather than the customer-level perspective of CAC.
Use it to investigate whether additional go-to-market spending is associated with additional recurring revenue. Don't treat that association as proof that the spending caused every part of the increase.
Separate acquisition output from other changes
Consider a founder who raises prices while reducing marketing spending. The resulting efficiency measure could improve even if the company attracts fewer new customers.
Before interpreting the result, inspect its components:
- Revenue movement: Separate new-customer revenue from expansion, contraction, and churn.
- Timing: Choose a spending lag that reflects how customers buy.
- Comparability: Keep the calculation consistent and disclose changes to included expenses.
A small business with irregular contract wins can also produce a volatile result. Review the trend across comparable periods rather than turning an unusually strong reporting period into a permanent spending assumption.
The Magic Number is a diagnostic, not an automatic instruction to scale. If it improves, investigate which customers and channels contributed, then check their retention and gross-profit payback.
A founder should be able to trace the apparent improvement back to operating evidence. Without that reconciliation, the aggregate number may describe a pricing change, a delayed deal, or customer expansion rather than a repeatable acquisition engine.
10. Trial-to-Paid Conversion Rate
Trial-to-paid conversion measures the share of an eligible trial cohort that becomes paying customers. Define when a trial starts, what counts as paid, and how long you allow the cohort to convert.
Don't substitute lead-to-customer benchmarks for trial benchmarks. The SaaS sales KPI benchmark summary reports typical lead-to-customer conversion around 2%–5%, with reported averages of approximately 2.7% for SMB leads versus 1.0% for enterprise leads; those denominators aren't equivalent to product trials.
Measure the path to useful work
For a project-management product, an activation event might be completing a real workflow with a teammate. Compare conversion among users who reach that event with those who don't, while avoiding the assumption that the event itself caused purchase.
- Segment by source: Separate high-intent referrals from broadly targeted campaigns.
- Track elapsed time: Distinguish mature trial cohorts from users still evaluating.
- Test a specific obstacle: Change onboarding, upgrade messaging, or trial design separately.
Discovery also requires broader measurement. G2's buyer research reports that 61% prefer a rep-free buying experience, supporting the need to examine self-serve activity beyond sales-managed leads.
For example, a prospect may evaluate documentation and subscribe without requesting a demo. Track documentation engagement, self-reported discovery, activation, and sales-touch status, while acknowledging attribution gaps.
Improve the transition to product value before buying more low-intent trials.
10 Essential SaaS Sales Metrics Compared
| Metric | Calculation | 🔄 Tracking effort & inputs | 📊 What it shows | ⭐ Key advantage | 💡 Best use |
|---|---|---|---|---|---|
| Monthly Recurring Revenue (MRR) | Sum of active subscription revenue normalized monthly | Low–moderate; requires accurate billing and subscription data | Recurring revenue momentum and its sources | ⚡ Clear, verifiable view of current revenue | Monitoring SaaS growth and reporting traction |
| Annual Recurring Revenue (ARR) | MRR × 12 | Low if MRR is reliable; best based on a stable trend | Annualized scale of recurring revenue | Easy to compare with benchmarks and communicate to investors | Fundraising and milestone reporting |
| Customer Churn Rate | Customers lost ÷ customers at period start × 100; revenue churn uses lost MRR | Moderate; requires cancellation, downgrade, and cohort data | Customer or revenue losses over time | Highlights retention problems that can limit growth | Improving onboarding, support, and retention |
| Net Revenue Retention (NRR) | (Starting MRR + expansion − contraction − churn) ÷ starting MRR × 100 | Moderate–high; requires customer revenue changes over a defined period | Revenue retained and expanded from existing customers | Shows durability and growth potential without new sales | Evaluating customer value and expansion, especially by cohort |
| Customer Acquisition Cost (CAC) | Sales and marketing costs ÷ new customers acquired | Moderate; requires fully loaded costs and acquisition attribution | Cost and efficiency of acquiring customers | Helps allocate budgets across channels | Planning acquisition spend and assessing unit economics |
| Customer Lifetime Value (LTV) | (ARPA × gross margin) ÷ monthly churn rate | High; depends on reliable margin, revenue, and churn estimates | Estimated customer value over the relationship | Guides sustainable acquisition spending | Comparing customer segments, plans, or channels |
| LTV:CAC Ratio | LTV ÷ CAC | Moderate–high; inherits the data requirements of both inputs | Estimated lifetime value relative to acquisition cost | ⚡ Concise summary of unit economics | Assessing growth efficiency alongside payback period |
| CAC Payback Period | CAC ÷ (ARPA × gross margin) | Moderate; requires CAC, ARPA, and gross margin | Months needed to recover acquisition costs | Connects acquisition efficiency to cash flow and runway | Budgeting growth for cash-constrained or scaling teams |
| SaaS Magic Number | (Current-quarter revenue − prior-quarter revenue) × 4 ÷ prior-quarter sales and marketing spend | Moderate; requires quarterly revenue and spending data | Revenue growth generated relative to go-to-market spend | Supports decisions about scaling sales and marketing | Comparing go-to-market efficiency over time |
| Trial-to-Paid Conversion Rate | Trial users who become customers ÷ total trial users × 100 | Low–moderate; requires trial cohorts and conversion tracking | How effectively trials or freemium experiences lead to payment | Actionable signal for product value and onboarding | Testing activation, pricing, and trial flows |
Build a Dashboard That Drives Decisions, Not Just Data
A useful dashboard doesn't need every available measurement on its front page. It needs enough evidence to answer the decisions you're making: whether to acquire more customers, improve retention, change pricing, or preserve cash.
MRR and ARR describe scale. Churn and NRR describe durability. CAC, LTV, and payback help evaluate acquisition economics. Trial conversion helps you investigate whether interested users reach enough value to pay, while the Magic Number provides an aggregate efficiency check.
Review the operating dashboard monthly, but don't force every metric into the same observation window. A recent trial cohort, a long enterprise sales cycle, and an annual renewal cohort require different amounts of time before their outcomes are interpretable.
Choose the comparison before choosing the target
Segment benchmarks according to your business model. The SaaS Capital retention research reports median gross revenue retention of about 95% for companies with annual contract values above $250,000, versus roughly 91% below that level.
That difference is a reason to question comparisons, not an instruction to move upmarket. Larger contracts may require a different sales process, product scope, and delivery commitment that your team shouldn't adopt solely to pursue a retention benchmark.
Use qualitative segmentation before interpreting the numbers:
- Self-serve versus sales-led: Separate product evaluation from sales-managed qualification.
- Lower versus higher contract value: Compare acquisition effort, renewal timing, and customer concentration.
- Subscription versus usage pricing: Distinguish committed recurring revenue from variable consumption.
Make the evidence inspectable
For each metric, record its definition, source system, reporting date, exclusions, and responsible owner. Show cohort sizes and explain material changes rather than publishing percentages without their denominators.
Verified traction makes the underlying observations more credible, but it doesn't validate every conclusion drawn from them. A Stripe connection can substantiate billing activity; it can't establish that customers will remain indefinitely or that a campaign caused every subscription.
For founders seeking support, Fundl offers traction pages connected to Stripe, GitHub, and analytics. Its refreshed revenue, build-activity, and audience signals let backers examine source-verified activity rather than relying only on manually prepared updates.
Keep forecasts clearly separate from observed performance. Publish the evidence, explain the assumptions, and identify the next operating decision. That approach gives both founders and backers a more useful basis for judging progress than an isolated milestone.
Fundl lets creators raise reward-based support using live, source-verified traction pages connected to Stripe, GitHub, and analytics. Visit Fundl to connect your data and give backers a refreshed view of the revenue, product activity, and audience signals behind your SaaS metrics.