
Efficiency isn't about spending less. A team can cut costs, slow hiring, and still build a weak business. The sharpest signal is how retention and acquisition interact. One benchmark analysis found companies with high Net Revenue Retention and low CAC payback averaged 71% growth and a 47% Rule of 40 score, while the low retention, high payback group averaged only 10% growth and a 5% Rule of 40 score, as shown in Kyle Poyar's 2025 SaaS benchmarks analysis. That's the right way to use SaaS efficiency metrics. Don't rank them alone. Read them as a connected scorecard.
Use acquisition metrics to decide whether to scale spend. Use retention metrics to test whether customers keep finding value. Use margin and productivity metrics to check whether delivery and headcount can support growth without burning cash. Then use company level metrics to decide whether raising capital makes sense, or whether you need to fix the engine first.
The eight metrics below cover those decisions. Each one includes the formula, what it hides, and what to do next based on the result. Track them consistently, by cohort and channel where possible, and compare yourself to your own trend before you chase a universal benchmark. A single median across different ARR bands, sales motions, and pricing models will mislead you more often than it helps you.
Table of Contents
- 1. Burn Multiple
- 2. SaaS Magic Number
- 3. CAC Payback Period
- 4. Rule of 40
- 5. Net Revenue Retention
- 6. Gross Margin
- 7. ARR per Employee
- 8. LTV:CAC Ratio
- Comparison of 8 Essential SaaS Efficiency Metrics
- Build One Connected Efficiency Scorecard
1. Burn Multiple
Start with the capital question. Burn Multiple = Net Burn ÷ Net New ARR for the same period. Net burn is cash spent minus cash collected. Net new ARR is new ARR plus expansion, minus contraction and churn. If you burned cash and added little net new ARR, the ratio exposes it fast. Lower is better because you're buying each dollar of durable growth with less cash.

A solo founder shows why period choice matters. One annual deal lands in March, hosting is prepaid in April, and a monthly view swings from brilliant to terrible without any real change in the business. Use a trailing three month view for operating decisions and a trailing twelve month view for fundraising conversations. You'll smooth irregular contracts and one off expenses.
How to Act on It
- Pair it with retention: A low burn multiple built on customers who churn next quarter isn't efficiency, it's borrowing growth from the future.
- Separate one offs: Label legal, migration, or annual prepayments so you don't cut product work to fix a timing artifact.
- Show your work: On a Fundl traction page, founders can present Stripe MRR alongside expense context, so backers see verified revenue movement instead of a screenshot with no denominator.
If burn multiple rises for two periods in a row, stop debating tactics. Either net new ARR is too weak, or your cost base grew ahead of demand. Find which one moved first, then fix that side.
2. SaaS Magic Number
Burn multiple judges the whole company. The Magic Number judges go to market spend specifically. Calculate it as (Current Quarter Revenue − Prior Quarter Revenue) × 4 ÷ Prior Quarter Sales and Marketing Spend. You're annualizing one quarter of revenue growth and comparing it with the spend that produced it.
Read the result as a decision trigger, not a grade. A result above roughly 0.75 generally supports investing more in go to market. A result below about 0.5 tells you to fix targeting, messaging, activation, or sales capacity before adding budget. Between those points, hold spend steady and improve conversion.
Don't scale a channel because one quarter looked good. Compare at least four quarters, because enterprise deals and annual renewals land unevenly.
Segment it or you'll learn nothing useful. A blended number can hide a strong self serve motion subsidizing an expensive outbound motion. Run the calculation for paid search, content, partnerships, and outbound separately, using the revenue each channel produced. Stripe revenue data helps here because you can tie quarterly changes to real subscriptions instead of CRM stages that never closed.
Take a practical example. Your overall Magic Number looks acceptable, but the paid segment drags while organic signups convert cheaply. The correct move isn't cutting all marketing. It's reallocating budget toward the channel that already works, then retesting paid with a narrower audience and a clear stop rule.
3. CAC Payback Period
CAC Payback Period answers a cash question. How many months until a customer repays what you spent to win them? Use Customer Acquisition Cost ÷ (Average Revenue per Account × Gross Margin %). The gross margin adjustment matters. Revenue doesn't repay acquisition costs, gross profit does.

Many founders understate CAC and then wonder why growth eats cash. Include ad spend, sales and marketing tools, commissions, and the portion of salaries spent on acquisition. If you're a founder doing demos at night, assign your time a cost in an internal version of the metric. Unpriced founder labor makes product led growth look artificially cheap, especially for indie teams with near zero paid spend.
Where Founders Get Tripped Up
Monthly and annual plans behave differently, so track payback separately for each. An annual discount pulls cash forward, but it can also mask weak monthly activation. Track by channel too. Customers from a comparison site may pay back slowly and churn early, while referrals pay back fast and expand.
Shorter payback lets you recycle capital into the next cohort, which is why bootstrappers should watch it weekly during experiments. If payback lengthens, check three things in order. Did CAC rise, did starting revenue per account fall, or did gross margin drop? Each cause needs a different fix. Displaying payback on a Fundl page, with the inputs visible, shows backers you understand your economics instead of just reporting growth.
4. Rule of 40
The Rule of 40 adds your revenue growth rate to your profit margin, commonly EBITDA margin or free cash flow margin. If the sum reaches 40%, you're balancing growth and profitability in a way mature SaaS buyers recognize. A fast growing company can run a negative margin. A slower company needs profit to compensate.
Use it carefully before scale. The Rule of 40 is less useful below $10 million ARR because small denominator changes, founder compensation choices, and irregular annual contracts distort both growth and profitability, a limitation covered in CFO Advisors' burn multiple benchmarks for Series A SaaS. That same coverage notes benchmark data from 563 firms was segmented by ARR size, sales motion, and pricing model. Collapsing those groups into one median conceals structural differences you need to see.
For an early stage founder, the score can punish sensible decisions. You hire a support lead before churn spikes, margin dips, and the score falls even though retention improves later. Or you pay yourself nothing, margin looks strong, and the business appears more profitable than it would with a market salary.
Track both components monthly and state which profit definition you're using. Don't switch between EBITDA and free cash flow to make a quarter look better. For pre scale teams, prioritize growth quality, burn efficiency, cohort retention, and cash runway. Treat the Rule of 40 as a later stage context metric, not your operating target.
5. Net Revenue Retention
Net Revenue Retention measures what your existing customers are worth after expansion, contraction, and churn. The formula is (Starting MRR + Expansion − Contraction − Churn) ÷ Starting MRR, excluding new customers. Above 100%, your installed base grows revenue without new logos. Below that line, acquisition has to outrun a leak every month.

Don't celebrate a headline number until you split it. Other 2025 coverage places median NRR near 101%, which means expansion only slightly offsets churn and contraction for the typical company. That's not proof of exceptional product strength. Meanwhile, public data infrastructure and observability companies have at various points reported NRR well above 120%, driven by usage based expansion. The model matters. Usage pricing expands naturally when customers succeed, while flat seat pricing needs new teams or tiers.
Read It by Cohort
- Cohort view: Newer customers may retain worse after a pricing or onboarding change, and a blended NRR won't show it.
- Expansion source: Separate price increases from seat growth and real usage growth, because only the last two prove deeper adoption.
- Segment view: Check gross revenue retention, logo retention, and expansion by customer size together.
Strong NRR compounds with every other metric on this list, including the broader set covered in Fundl's guide to SaaS growth metrics. Link Stripe subscription data to your reporting so retention is verifiable, not reconstructed from invoices months later. If NRR is weak, fix activation and core usage before buying more traffic.
6. Gross Margin
Every efficiency claim eventually hits delivery cost. Gross Margin = (Revenue − Cost of Revenue) ÷ Revenue. Cost of revenue includes hosting, third party APIs, payment processing, support tooling, and the direct service costs needed to keep customers running. What's left funds product, sales, and profit.
Healthy SaaS businesses typically aim for gross margins in the high 70s percent or higher. AI heavy products often run lower because inference, embeddings, and model API calls scale with usage. That's not automatically a problem. It becomes a problem when your pricing doesn't move with usage, so your most active customers are your least profitable ones.
Practical rule: If a customer segment costs more to serve every month and pays the same flat fee, growth in that segment destroys margin. Price the usage or cap it.
Build a per customer cost view early. Tag infrastructure spend by product area where you can, and monitor cost per active account for API heavy features. A founder selling an AI summarizer, for example, should know the model cost for a light user and a power user before setting plan limits. That data sets pricing floors, fair use thresholds, and upgrade triggers.
Categorize costs consistently from the start, and don't move support salaries in and out of cost of revenue between quarters. Consistency makes trends meaningful and connects directly to the wider picture in Fundl's overview of profitability indicators. Use gross margin to test new features before launch, not after a cloud bill surprises you.
7. ARR per Employee
ARR per Employee = Total ARR ÷ Full Time Equivalent Employees. It shows how much recurring revenue your team supports per person. Higher values usually signal gains from automation, self serve distribution, and product design that doesn't need manual work for every account.
The trap is treating leanness as virtue on its own. A two person company can post a strong number while the founders answer support at midnight, ship slowly, and lose deals they can't attend. An enterprise SaaS company with implementation specialists will naturally run lower, yet may retain far better. Compare this metric inside your own model over time, not against a company with a different motion.
Define your denominator once and keep it. Decide how you count contractors, part time help, and founders. A fractional designer who works ten hours a week isn't a full time equivalent, but excluding all contractors while relying on five of them inflates the result. Write the rule down in your metrics sheet.
A Better Version for Small Teams
Solo founders should also track revenue per founder hour. It captures the constraint, your time, and it exposes low value work that ARR per employee hides. If manual onboarding eats your week, automation or a recorded setup flow may lift productivity more than any new feature.
Always pair this metric with burn and gross margin. Rising ARR per employee with falling margin can mean you are pushing usage costs up while keeping headcount flat. Rising ARR per employee with stable margin and retention is genuine advantage. That is the combination worth hiring against.
8. LTV:CAC Ratio
The LTV:CAC Ratio compares what a customer returns over their lifetime with what you spent to acquire them. A common LTV formula is (ARPA × Gross Margin %) ÷ Churn Rate, then divide LTV by CAC. A ratio of about 3:1 is widely cited as healthy, meaning a customer returns roughly three times their acquisition cost.
This short explainer walks through the ratio before the detail below.
Treat the ratio as an estimate with assumptions you must disclose. Churn based LTV explodes when churn is measured on a tiny early cohort, and it assumes today's customers behave like tomorrow's. Cap customer lifetime at a reasonable horizon, such as three to five years, to avoid presenting fantasy value to yourself or to backers.
The infographic below summarizes what the ratio reveals and what it leaves out.
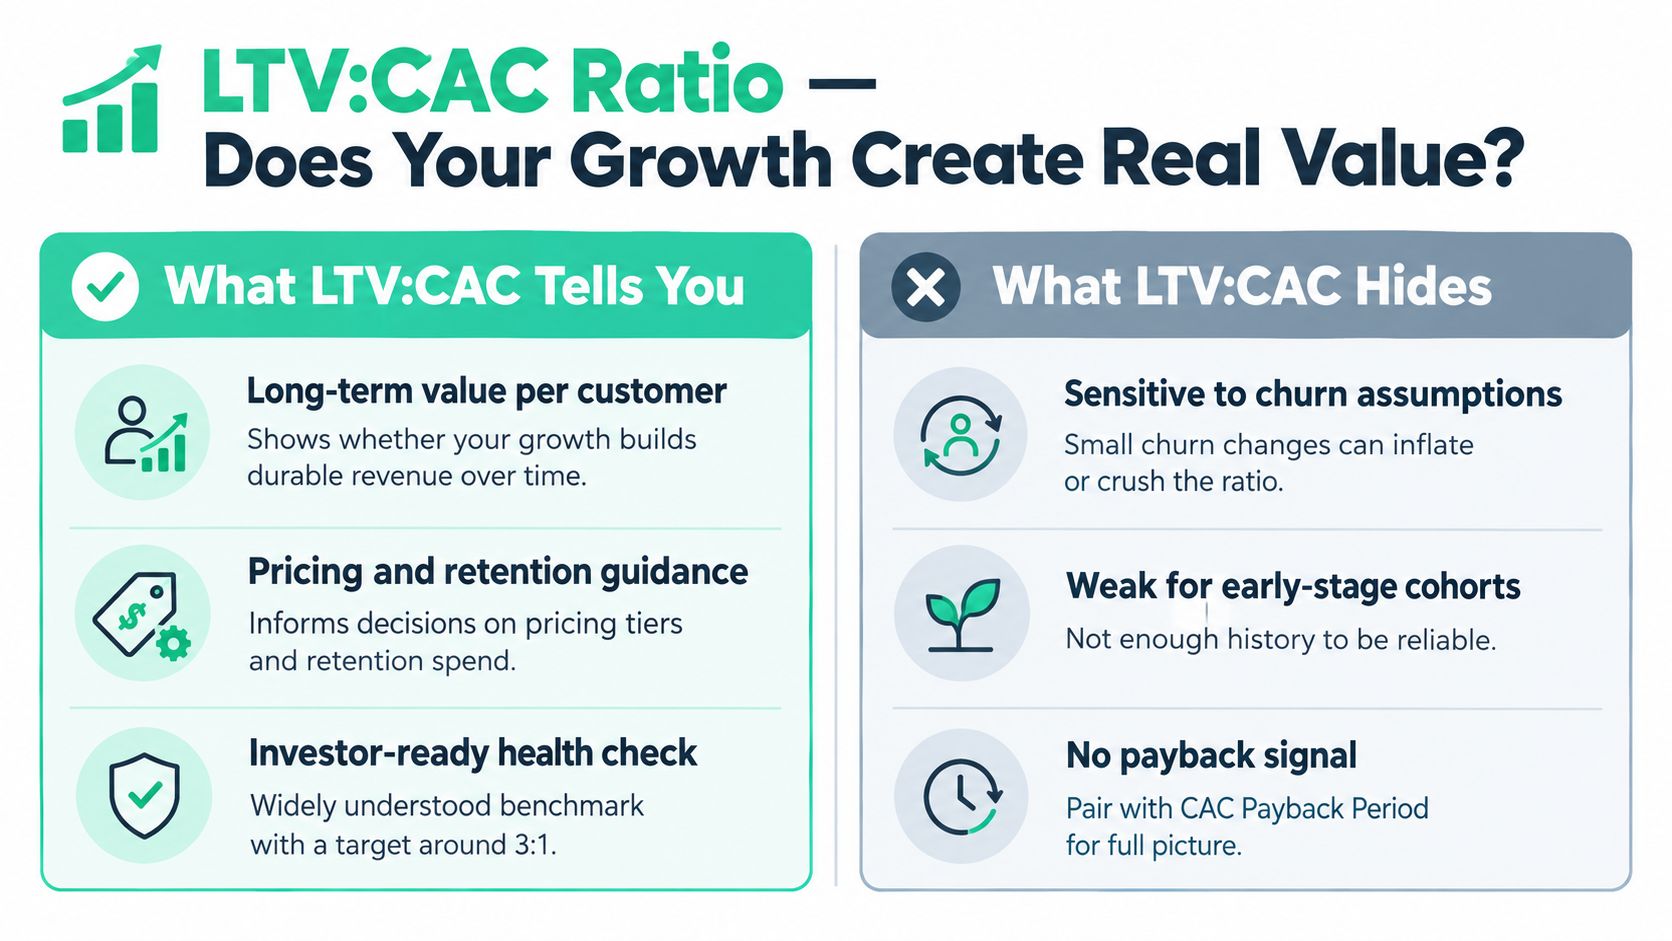
Calculate it by acquisition channel and by segment, never only as a company average. One channel can produce durable customers while another produces discount seekers with the same initial CAC. That's why retention inputs matter so much, a point developed further in Fundl's guide to customer retention metrics. Present LTV:CAC next to CAC payback on your Fundl page. The ratio shows long run return, payback shows cash timing, and backers need both to judge whether growth is financeable.
Comparison of 8 Essential SaaS Efficiency Metrics
Start with the low-effort rows if your data is thin, then add the moderate-effort metrics as your tracking matures. The benchmark column is a guide, not a verdict, so segment by channel and cohort before you act on any single number.
| Metric | 🔄 Calculation & Complexity | ⚡ Resource Requirements | 📊 Expected Outcome | ⭐ Ideal Use Case | 💡 Key Advantage |
|---|---|---|---|---|---|
| Burn Multiple | Net burn ÷ net new ARR; moderate effort | Cash burn and ARR data; use trailing periods to reduce volatility | Lower values indicate more capital-efficient growth | Early-stage SaaS companies not yet expected to be profitable | Summarizes cash efficiency of growth; pair with NRR |
| SaaS Magic Number | Quarterly revenue increase × 4 ÷ prior-quarter sales and marketing spend; low effort | Quarterly revenue and sales and marketing spend | Higher values suggest more efficient go-to-market spending | Assessing whether to scale or improve sales and marketing | Simple, investor-recognized indicator; review multiple quarters |
| CAC Payback Period | CAC ÷ monthly gross-margin-adjusted revenue per account; moderate effort | Acquisition costs, account revenue, and gross margin | Fewer months indicate faster recovery of acquisition costs | Managing cash and comparing acquisition channels or segments | Connects acquisition spend to cash recovery |
| Rule of 40 | Revenue growth rate + profit margin; low effort | Revenue growth and a clearly defined EBITDA or free cash flow margin | A combined score of 40% or more is a common health benchmark | Evaluating more mature SaaS companies, typically above roughly $10M ARR | Balances growth and profitability in one score |
| Net Revenue Retention (NRR) | (Starting MRR + expansion − contraction − churn) ÷ starting MRR; moderate effort | Recurring revenue tracked by customer or cohort | Above 100% means existing customers generate more revenue over time | Measuring retention, expansion, and product stickiness | Shows growth from existing customers without new-logo revenue |
| Gross Margin | (Revenue − cost of revenue) ÷ revenue; moderate effort | Revenue and consistently categorized delivery costs | Higher margins indicate more efficient product delivery | Assessing SaaS scalability, pricing, and delivery costs | Informs pricing, CAC payback, and LTV calculations |
| ARR per Employee | ARR ÷ full-time equivalent employees; low effort | ARR and a consistent employee-count policy | Higher values generally indicate greater output per person on the team | Comparing operational efficiency over time, especially for lean teams | Simple measure of revenue generated per employee |
| LTV:CAC Ratio | Estimated customer lifetime value ÷ CAC; moderate to high effort | ARPA, gross margin, churn, and acquisition cost data | Around 3:1 is a commonly cited benchmark | Evaluating unit economics by acquisition channel | Combines retention, margin, pricing, and acquisition cost; pair with payback period |
Build One Connected Efficiency Scorecard
No single metric explains whether a SaaS business is efficient. A strong Magic Number with weak retention means you're filling a leaky bucket faster. Strong NRR with poor gross margin means loyal customers still cost too much to serve. Strong ARR per employee with rising burn can mean a lean team is spending heavily everywhere except salaries. You need the connections.
Organize your review around four decisions. First, should you scale acquisition? Answer that with CAC payback, the Magic Number, and LTV:CAC, segmented by channel. Second, is the product creating durable value? Answer that with NRR, split into gross retention, contraction, and expansion by cohort. Third, can the operating model support growth? Answer that with gross margin and ARR per employee. Fourth, can you justify raising capital? Answer that with Burn Multiple, cash runway, and, once you're at meaningful scale, the Rule of 40.
Define every calculation once and write the definitions where your team can see them. Note the denominator, the cohort window, whether founder time is priced in, and which costs sit in cost of revenue. That transparency matters most pre scale, when borrowed benchmarks fit badly and small choices swing the result. Review the scorecard monthly for leading signals and quarterly for capital decisions. A simple KPI dashboard for decision-making helps you keep those reviews consistent instead of rebuilding spreadsheets each time.
Then fix one bottleneck at a time. If payback is long, work on activation, starting price, or channel mix, then measure the next cohort. If NRR slips, interview churned accounts and track usage frequency before launching expansion features. If margin drops, find the customers or features driving cost per account. Document what you changed and what moved, so your next decision starts from evidence rather than memory.
Communicate that progress with verified data. Platforms such as Fundl let founders present live, source verified metrics from connected systems like Stripe, GitHub, and analytics, so supporters see current traction instead of stale screenshots. Show the metric, the trend, and the decision it drove. That's how SaaS efficiency metrics stop being a reporting exercise.
Fundl helps founders turn metrics like MRR, retention, and shipping activity into a live, source verified traction page that backers can check in real time. If you're tracking your efficiency scorecard and want that progress to support your next raise, visit Fundl and publish the numbers you're already managing.