
Median B2B SaaS growth sits at 24%, and net revenue retention is 101%. Those two numbers look straightforward until you compare a self-serve founder-led product with a sales-led enterprise business, where the same benchmark can mean something completely different.
| Metric | Benchmark signal | What it actually tells you |
|---|---|---|
| B2B SaaS growth | 24% median | Growth pace, but not whether it comes from new logos or existing accounts |
| Net Revenue Retention | 101% median | Existing customers are roughly holding steady, with modest expansion |
| Gross Retention | 91% median in one 2025 B2B SaaS benchmark | How much recurring revenue survives before expansion is counted |
| CAC and payback | Varies sharply by maturity | Acquisition efficiency changes with channel mix, team structure, and scale |
Raw benchmarks are useful only when the operating model matches the comparison set. A solo founder selling self-serve can look “behind” a venture-backed company on headline growth while running a much cleaner business with stronger product pull and a different cost structure.
Table of Contents
- Why SaaS Metrics Benchmarks Require Context
- Retention as the True Diagnostic for Product-Market Fit
- Benchmarking Growth Expectations Across ARR Bands
- The Hidden Trap of Comparing Small Founders to VCs
- Building Auditable Retention Frameworks for Fundraising
- Publishing Metrics to Build Backer Credibility
- Applying Benchmarks to Different SaaS Models
Why SaaS Metrics Benchmarks Require Context
The most common mistake founders make with saas metrics benchmarks is treating one table as a universal scorecard. That's how a healthy founder-led product gets judged against a staffed, capital-intensive company that sells differently, spends differently, and retains customers for different reasons.
The comparison becomes even noisier when people ignore how the business is built. A self-serve product, a usage-led developer tool, and a land-and-expand enterprise platform all generate revenue through different motions, so the same benchmark can describe three very different realities. The practical response is to compare like with like, not just company size with company size.
Practical rule: a benchmark only matters if the customer motion, pricing model, and contract structure are close enough to yours to make the comparison meaningful.
That's why retention and growth should be read as operating signals, not vanity badges. The Fundl growth metrics guide is useful here because it frames metrics as a connected set, not isolated numbers. If you also want a retention-focused primer, SigOS insights on customer retention is a good companion read.
The right question isn't “Am I above the benchmark?” It's “Which benchmark is structurally comparable to my business?” Once you answer that, the numbers start telling a story about durability instead of performance theater.
Retention as the True Diagnostic for Product-Market Fit
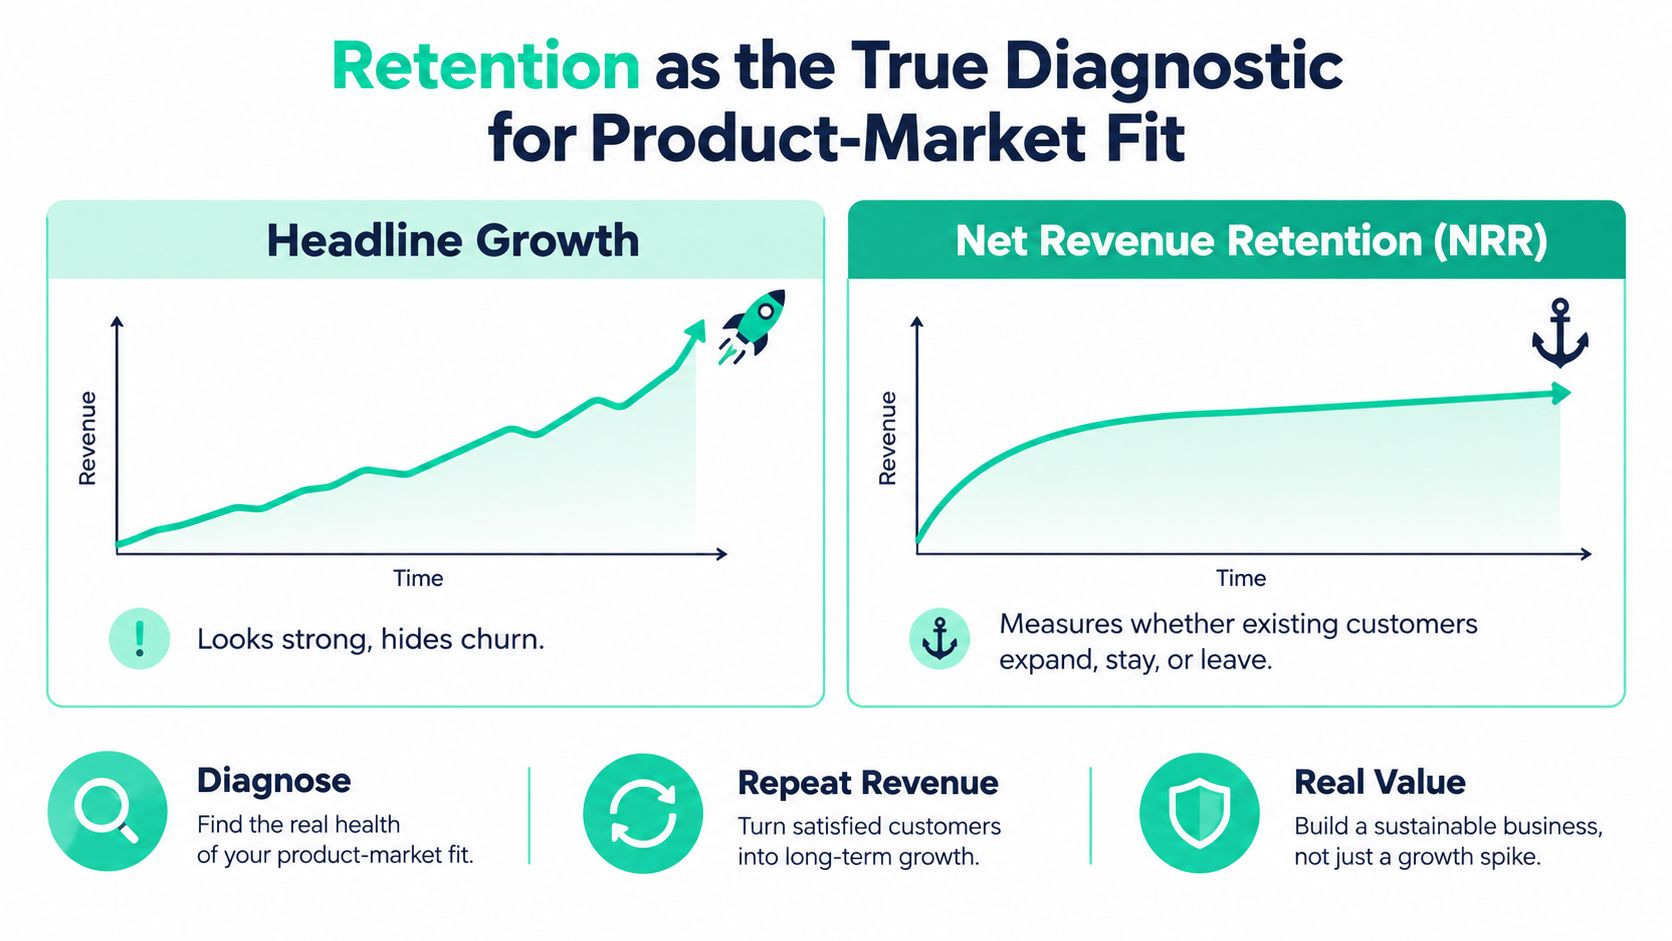
Headline growth shows the outcome. Retention tests whether the revenue base can keep producing it. KeyBanc Capital Markets' 2024 survey reported roughly 90% gross retention and 101% net retention among established private SaaS companies. Those figures show why expansion alone does not establish product-market fit. KeyBanc Capital Markets 2024 private SaaS survey
What NRR reveals that growth doesn't
Net Revenue Retention measures recurring revenue from existing customers after upgrades, added seats, higher usage, and contraction. Gross Retention excludes expansion and measures how much of the starting recurring revenue remains. A high NRR alongside weak GRR can indicate that a few accounts are masking losses across the wider customer base. For a deeper framework, see the customer retention metrics guide.
A self-serve product and a sales-led platform can show similar NRR for different reasons. Self-serve retention may reflect habitual usage across many smaller accounts, while sales-led retention may depend on renewals, account expansion, and a smaller group of larger customers. Comparing either model with a venture-backed average without separating the operating motion can misclassify a healthy indie business.
A product with loyal customers and modest expansion often has stronger foundations than one posting rapid growth through a handful of expanding accounts while other customers leave.
A business can grow on the back of a few expanding accounts and still have fragile product-market fit.
Why retention is harder to fake
Campaigns, launches, or founder-led selling can lift growth temporarily. Renewals and continued usage require the product to remain embedded in a customer's workflow, budget, or operating process. Persistent retention therefore provides stronger evidence of repeatable demand than a single period of headline growth.
Benchmarking Growth Expectations Across ARR Bands
Growth expectations change as the denominator changes. A young product with a small ARR base can post dramatic percentage growth without proving much about durability, while a larger business has to work harder to produce the same percentage lift. That's why ARR-band comparisons matter, even before you add the question of operating model.
SaaS Capital's 2025 B2B SaaS benchmark found median growth of 24%, median NRR of 101%, and median GRR of 91%. It also found that companies with NRR between 110% and 120% grew about 9 percentage points faster than those in the 100% to 110% range. SaaS Capital 2025 B2B SaaS retention benchmarks
Why stage changes the meaning of growth
At the smallest stages, percentage growth can look impressive even when absolute revenue is still thin. At more mature stages, that same percentage can imply a much stronger underlying machine because the company is defending a larger installed base while still adding net new revenue. The metric isn't lying, it's just incomplete without the denominator's context.
Benchmarks also need to account for the fact that a company's growth engine changes as it matures. Early on, founder distribution, product-led loops, and a narrow customer profile can drive outsized movement. Later, the company often needs repeatable sales execution, clearer segmentation, and more disciplined retention to sustain momentum.
Interpretation rule: growth should be judged against what the company has to do to earn it, not just against the percentage printed on a dashboard.
Comparing growth without fooling yourself
A useful comparison set asks three questions:
- How large is the base? Small bases can exaggerate percentage growth.
- How repeatable is the motion? One-off spikes don't tell you much about durability.
- What is retaining after the sale? If customers don't stay, growth is buying time rather than compounding value.
That's why a benchmark table without operating detail is only half a benchmark. A company can appear slow on a chart and still be building a far healthier revenue engine than a faster-growing peer with a fragile base.
The Hidden Trap of Comparing Small Founders to VCs
Indie founders often compare their numbers to venture-backed companies and feel behind before they've even adjusted for operating model. That comparison is usually unfair. A founder-led self-serve business, a staffed outbound team, and a VC-backed enterprise seller do not acquire customers in the same way, so their acquisition costs and payback periods can't be read as if they were interchangeable.
Recent benchmark data makes that difference visible. Median CAC rises from $1,248 at seed to $6,734 for Series C+ companies, while CAC payback falls from 16.8 months to 11.3 months as companies scale. Forth & Scale 2025 SaaS growth benchmarks
Why cash CAC is not the full story
A solo founder can post low cash CAC by leaning on content, community, or direct relationships. That doesn't mean the acquisition motion is free. It can include unpaid labor, slower pipeline creation, and a channel mix that wouldn't scale the same way inside a staffed sales org.
Existing benchmark coverage often compresses all of that into one acquisition number. That's misleading because it ignores founder time, the share of sales motion that happens through personal credibility, and how much the customer segment itself influences the economics. A student-facing self-serve tool and a workflow platform selling into IT teams won't have the same economics even if both are “SaaS.”
What founders should compare instead
The fairer comparison is model to model, not headline to headline. A founder-led product should look at the quality of its inbound motion, the cost of creating demand, and the time it takes customers to become active. A sales-led company should be judged on pipeline conversion, payback discipline, and how much recurring revenue sticks after the close.
Useful benchmark filter: compare self-serve with self-serve, sales-led with sales-led, and founder-led with founder-led whenever possible.
That approach doesn't make the numbers softer. It makes them truer. If you're a small team, you need benchmarks that reflect the labor structure behind your growth, not just the final ARR line.
Building Auditable Retention Frameworks for Fundraising
Retention metrics only help if the calculation is clean. NRR above 100% means expansion revenue from existing customers offsets cancellations and downgrades, but that conclusion only holds when the cohort is defined consistently and the calculation handles refunds, pauses, discounts, and currency conversion in the same way every time. A dashboard that hides the math can make a strong business look weaker or a weak one look polished.
The most credible retention view is a cohort view. A live dashboard should show starting cohort ARR, expansion ARR, contraction ARR, churned ARR, and ending cohort ARR. That makes the percentage auditable instead of decorative, which matters when backers are trying to judge whether demand is durable or artificially inflated.
What belongs on the dashboard
| Metric Category | Definition | Why It Matters |
|---|---|---|
| Starting Cohort ARR | Revenue from the cohort at the beginning of the period | Establishes the base for retention math |
| Expansion ARR | Additional recurring revenue from existing customers | Shows whether customers are deepening usage or spend |
| Contraction ARR | Revenue lost from downgrades or reduced usage | Reveals weakening account strength |
| Churned ARR | Revenue lost from cancellations | Identifies direct customer loss |
| Ending Cohort ARR | Revenue remaining at the end of the period | Confirms the final retained base |
The Fundl integration guide fits this mindset because the underlying principle is source-verified data, not a screenshot and a promise. When the retention math is visible, backers can inspect the actual mechanics of growth instead of trusting a polished percentage.
Why GRR still deserves first attention
Expansion can temporarily lift NRR even while the core customer base weakens. That's why GRR deserves close attention first, especially if a business is still proving repeatability. If the base is leaking, upsells are doing too much of the work.
Auditable retention frameworks don't just satisfy finance curiosity. They make fundraising conversations more precise because the founder can point to the exact cohort movements that explain the headline number.
Publishing Metrics to Build Backer Credibility
Backers don't just want proof that revenue exists. They want proof that the revenue is earned by a product people keep using. That's why the best traction pages segment metrics by business model, customer size, and maturity instead of dumping one blended number onto the screen.
A self-serve product should not present itself the same way as an enterprise platform with long contracts and account management. The first needs to show usage quality, retention, and the shape of repeat revenue. The second needs to show how accounts expand, how much revenue stays in place, and how the sales motion converts into durable cohorts.
What creates credibility
Show the customer base. Revenue without customer counts hides concentration risk.
Show both GRR and NRR. Expansion is meaningful only when the base is holding.
Show the cohorts. A single percentage is too easy to misread.
Show the motion. Self-serve and sales-led businesses need different interpretations.
If you want a practical example of how teams present operational numbers, compare sales dashboard examples with your own reporting. The useful lesson isn't the layout itself. It's that the best dashboards help an outsider understand how money moves through the business, not just how much money there is.
When backers can see the mechanics, they don't have to guess whether growth came from durable product engagement or from a temporary spike in attention. That shift changes the fundraising conversation from persuasion to verification.
Applying Benchmarks to Different SaaS Models
A self-serve product, a hybrid PLG tool, and an enterprise platform require different benchmark interpretations. Their customer behavior, sales cycles, and retention patterns produce different operating signals. Comparing them against one blended target can make a durable business look weak or hide fragile growth.
For a founder-led, self-serve company, the central question is whether the installed base continues paying and using the product. A sales-led enterprise business needs evidence that larger deals recur, accounts remain stable, and expansion supports the cost of acquisition. The same growth result can therefore indicate healthy demand in one model and inefficient selling in another.
Practical examples by operating model
A solo founder serving a narrow niche may accept slower top-line growth when customers remain active and expand naturally. A product-led team can use retention cohorts to show that product usage generates demand beyond paid acquisition. A sales-led company must show that its pipeline converts into recurring revenue that remains in place long enough to justify the sales motion. That execution also requires tracking outbound sales metrics alongside retention cohorts.
A benchmark becomes actionable when you can explain the operating model behind it in one sentence.
Translate external comparisons into the mechanics of your own business. A founder-led, low-touch company still validating demand should examine the quality of each retained account, usage consistency, and the share of growth produced by repeatable behavior rather than isolated bursts. Larger-account businesses should place greater weight on cohort durability, renewal patterns, and expansion mechanics.
These distinctions also affect how performance is presented to outsiders. Fundl can connect live metrics to a shareable traction page, giving readers access to the same operating signals used to manage the business. The value lies in making revenue quality, retention, and customer behavior inspectable, not in displaying a larger volume of data.
If you want backers to verify your SaaS metrics, visit Fundl to publish a traction page showing the numbers behind growth. Source-linked evidence gives investors a clearer basis for judging durability than a pitch deck alone.