
You opened the billing dashboard, then the product tool, then Google Analytics 4, and the three numbers still refuse to agree. MRR looks healthy in one place. Activation looks thin in another. Acquisition looks busy in a third. That mismatch is the normal first week with SaaS metrics software, not a sign that your company is uniquely broken.
The stack is the reason. A compiled industry analysis reports that 99% of organizations used at least one SaaS application by the end of 2025, so the hard part is no longer “use cloud software.” It is making fragmented systems produce one decision. Radixweb's SaaS statistics roundup is useful context here. Larger estates make the same problem louder. Zylo data summarized in industry research puts the average organization at 305 SaaS applications and $55.7 million in annual SaaS spend in 2025. That figure describes big companies, not an indie product, but the failure mode scales down. Colorlib's SaaS statistics summary is the source for those two figures. Identity, freshness, and definitions drift across tools.
This guide splits 10 options by job. Revenue truth is ChartMogul, Baremetrics, ProfitWell Metrics by Paddle, and Maxio. Product behavior is PostHog, Mixpanel, and Amplitude. Display is Databox, Geckoboard, and GA4. Mixing those jobs is how founders treat an MRR tool like a product analytics suite, or a wallboard like a billing ledger.
The same discipline shows up outside finance. OGTool's guide to GEO services is a reminder that what you buy, what you measure, and what gets cited are three different claims. Pick the layer, then wire the source.
Table of Contents
- 1. ChartMogul
- 2. Baremetrics
- 3. ProfitWell Metrics by Paddle
- 4. Maxio
- 5. PostHog
- 6. Mixpanel
- 7. Amplitude
- 8. Databox
- 9. Geckoboard
- 10. Google Analytics 4
- Top 10 SaaS Metrics Software Comparison
- Build a Stack You Can Trust and Share
1. ChartMogul
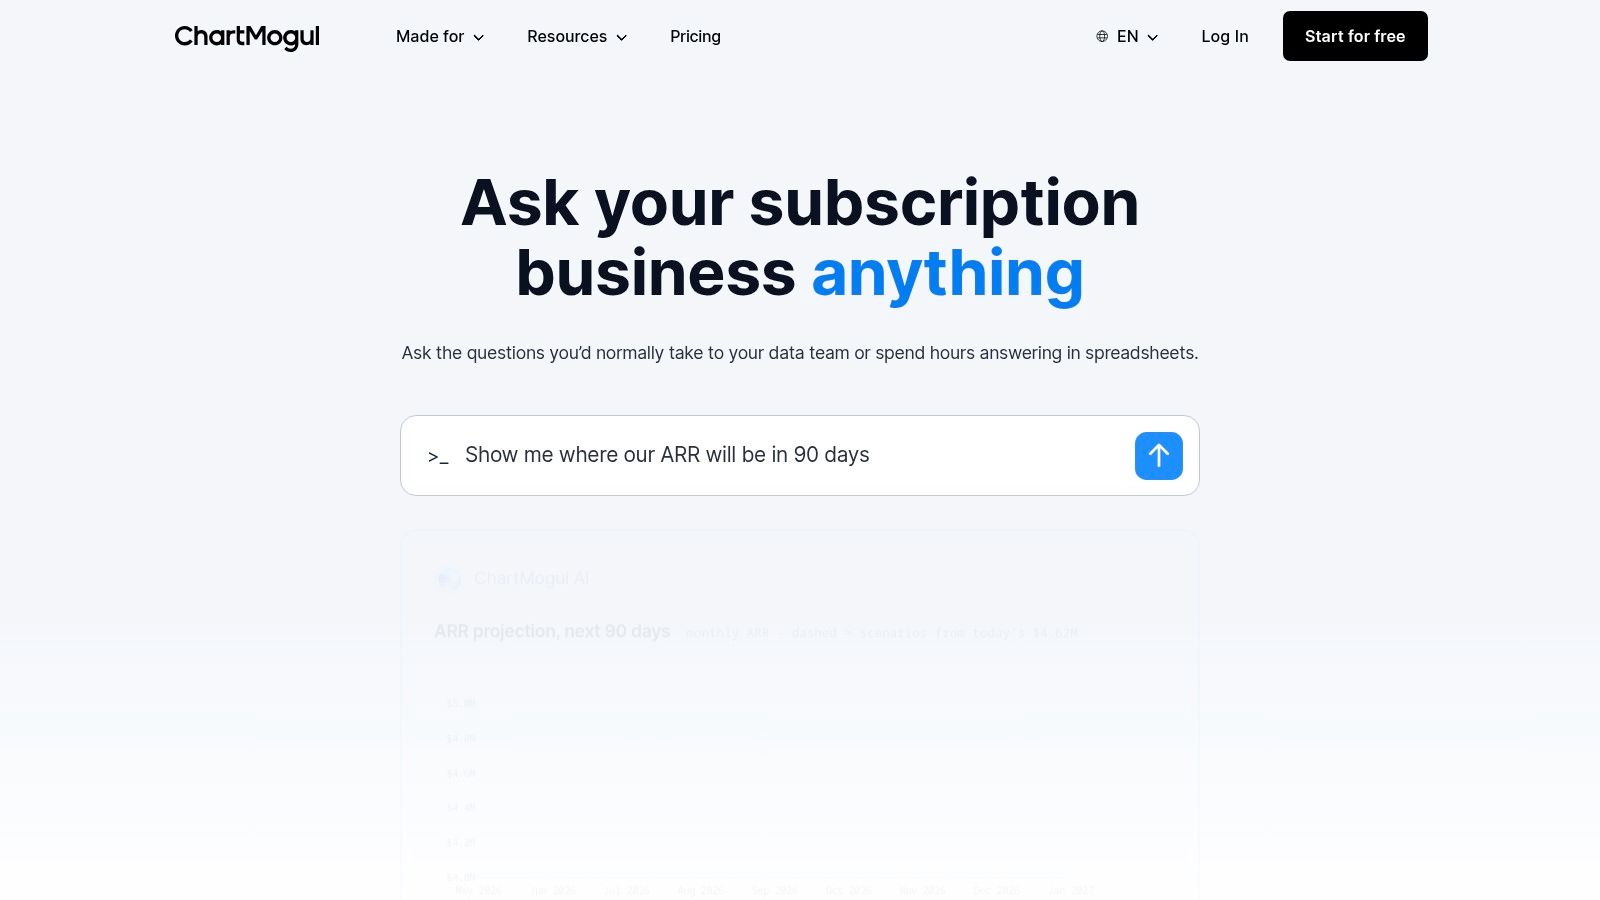
ChartMogul is subscription-revenue analytics for teams that need a dependable read on MRR, ARR, churn, and retention. It can pull from more than one billing system and sync CRM data, then push numbers toward a warehouse. Slack sharing is there when finance wants the weekly movement in a channel, not another login.
That focus is the trade-off. ChartMogul will not tell you which onboarding step people abandon. If subscription records already live in two processors plus a CRM, the consolidation is worth the setup. If you have one Stripe account and a handful of customers, the ARR-scaled Pro pricing can outrun the question you are asking. Published pricing moves with tracked ARR, so check it before you commit a young book of business.
Clean billing data is the true cost. Upgrades, discounts, refunds, taxes, and annual contracts have to be defined the same way every month. A 2025 SaaS Capital survey of more than 1,000 private SaaS companies reported median NRR of 101% for private B2B SaaS in 2024, including expansion, and GRR of 91% before expansion. Founderpath's SaaS KPI guide walks through why that split matters. NRR above 100% means the existing base grows without new logos. GRR shows what remains before upsells.
Use ChartMogul when revenue is the argument. Pair it with product analytics, and read SaaS growth metrics before you treat one dashboard as the whole company.
2. Baremetrics
Baremetrics is built for founders who want subscription health in plain language. It covers more than 28 subscription metrics, including MRR, ARR, churn, upgrades, and downgrades, plus trial reporting and automated email reports. Higher tiers add segmentation, benchmarks, and forecasting. Optional products cover payment recovery and cancellation insights. Plan contents change, so the pricing page is the contract, not a blog summary.
What it does well
It is strongest when you already have paying customers and you need to see who expanded, who downgraded, and which trials never converted. Segmentation is how you stop treating a $19 self-serve plan and a $2,000 annual contract as the same customer. Add-ons for failed payments and cancellation feedback attack involuntary churn and the “why they left” note that Stripe receipts never include.
Where it stops
Baremetrics is a poor home for app engagement or engineering activity. Benchmarks and forecasts need history. A product with 12 customers and two months of revenue will get a chart, not a strategy. Costs also grow with scale and with those add-ons, which is easy to underestimate when the base plan looks founder-friendly.
Start here if subscriptions are the business and product behavior already lives somewhere else. Skip it if you are still pre-revenue and mostly watching signups.
3. ProfitWell Metrics by Paddle
Paddle positions ProfitWell Metrics as subscription reporting you can turn on without a procurement cycle. Core Metrics is free. You get MRR, churn, upgrades, downgrades, cohorts, segments, and benchmarks against other subscription companies. It connects to payment systems including Stripe, Chargebee, and Paddle. Metrics Plus is paid and adds faster updates plus specialized reports.
Practical rule: A free revenue tool is still not a source of truth until you reconcile one month of MRR against the processor, including refunds and annual plans.
The free tier is the right test for a small team that wants SaaS-specific benchmarks next to its own numbers. Cohort and segment views help you see whether churn is a pricing problem or a single bad-fit group. Paddle says the free version updates every 3–6 hours. That lag is fine for a Monday review. It is a bad fit if you are watching a launch hour by hour.
It does not do general product analytics, and it does not publish a public KPI page for backers. Advanced reports sit on a paid plan or a conversation with Paddle. Use it as the revenue layer while the company is small. Move the “what did users do” question to a product tool.
4. Maxio
Maxio is financial operations for B2B SaaS, not a lightweight MRR widget. It ties customer, contract, invoice, revenue, and payment data together, then reports ARR, MRR, cohorts, and subscription momentum. Billing, collections, and subscription management sit in the same platform, with drill-down from a summary number to the customer and the transaction. Dashboards connect to finance systems and CRMs.
That breadth pays off when contracts are messy. Ramps, multi-year deals, and usage on top of a subscription break simple Stripe charts. Being able to open the invoice behind the ARR movement is how finance stops arguing with sales about whose spreadsheet is current.
The setup cost
A solo founder who wants last month's MRR will feel the weight. Pricing takes a sales conversation. Implementation is heavier than connecting a read-only billing key and waiting for charts. If your motion is self-serve and your contracts are standard, Maxio is more system than you need.
Pick Maxio when billing complexity is already the bottleneck. Keep a simpler revenue tool if the only gap is “we cannot see churn next to upgrades.”
5. PostHog
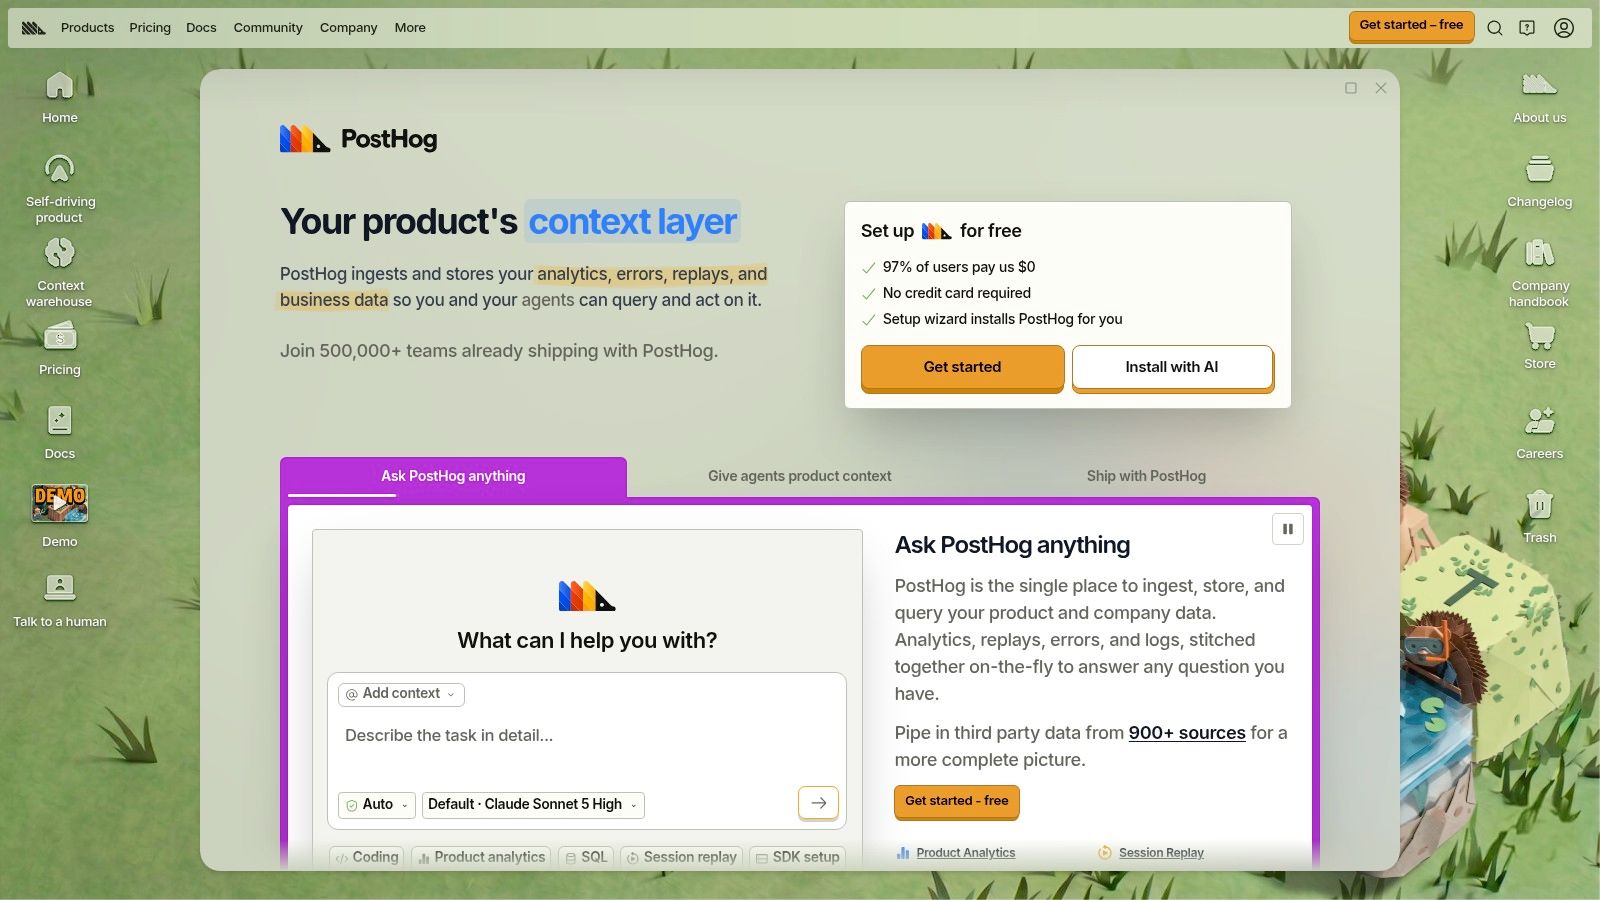
PostHog is the product-behavior layer for technical founders. Event analytics covers funnels, paths, and usage. Session replay and heatmaps show what the funnel chart only summarizes. Feature flags and experiments sit in the same product, so a developer-led team can ship a change and measure it without buying a second suite.
Product analytics includes 1 million events per month free, then usage-based charges. That allowance is enough to instrument a young app before you negotiate an annual analytics contract. The cost becomes less predictable once event volume climbs, especially if you capture every click instead of the few actions that prove activation.
Don't ask it for MRR
PostHog should not be your authoritative subscription ledger. Billing events can live beside product events, but MRR, refunds, and churn definitions belong in a revenue system. The setup cost is instrumentation and governance. Name events once, keep user identity stable, and resist the urge to turn on every module on day one.
Use PostHog when engineers will own the tracking. Use a narrower product tool if you only need a retention chart and you do not want flags, replay, and experiments in the same login.
6. Mixpanel
Mixpanel answers a narrower question than a finance suite. Where do people drop off, which paths do they take, and who comes back. Reports cover funnels, retention, and flows for web and mobile. Plan comparisons also include session replay and feature flags. The free plan includes up to 1 million events per month and unlimited seats. Growth pricing scales with event volume, which makes a low-traffic product easier to estimate than a surprise invoice at month three.
Unlimited seats matter on a small team. You can put product, support, and the founder on the same project without a per-seat argument. Published plan details help you sketch cost before the event stream gets noisy. You still have to instrument meaningful events. A pageview firehose will not explain activation.
Mixpanel is not where you reconcile recurring revenue. Stripe remains the ledger. Mixpanel tells you whether the people who paid actually reached the habit. If usage is the traction story, read SaaS usage metrics before you paste a MAU screenshot next to MRR and call them the same proof.
Skip Mixpanel if nobody will maintain the event taxonomy. A stale event name is worse than no chart.
7. Amplitude
Amplitude is product analytics for teams that want behavior, engagement, and growth in one place, then room to test. Behavioral reports cover funnels, retention, and cohorts. Depending on plan, the broader platform can include session replay, experimentation, guides, and surveys. The free plan includes up to 2 million events per month, which is a real starting point for a small product if you are disciplined about what you collect.
That feature list is also the warning. A founder who needs “how many teams used the core action this week” can drown in modules. Limits and advanced tools change by plan, so verify the current page before you design a workflow around a screenshot. Event collection and governance are not optional. If “active user” means something different in Amplitude than it does in billing, your retention story and your revenue story will fight in every update.
- Start with one cohort: Define activation as a single event, then build retention from that event.
- Keep experiments separate: Do not turn on guides and surveys until the core funnel is trusted.
- Leave revenue elsewhere: Amplitude complements a billing source of truth. It does not replace one.
Capgo's app behavior tracking guide is a useful companion if you are deciding which in-app actions deserve an event at all. Amplitude fits product and growth teams who will live in the data. It is extra surface area for a solo founder tracking three numbers.
8. Databox
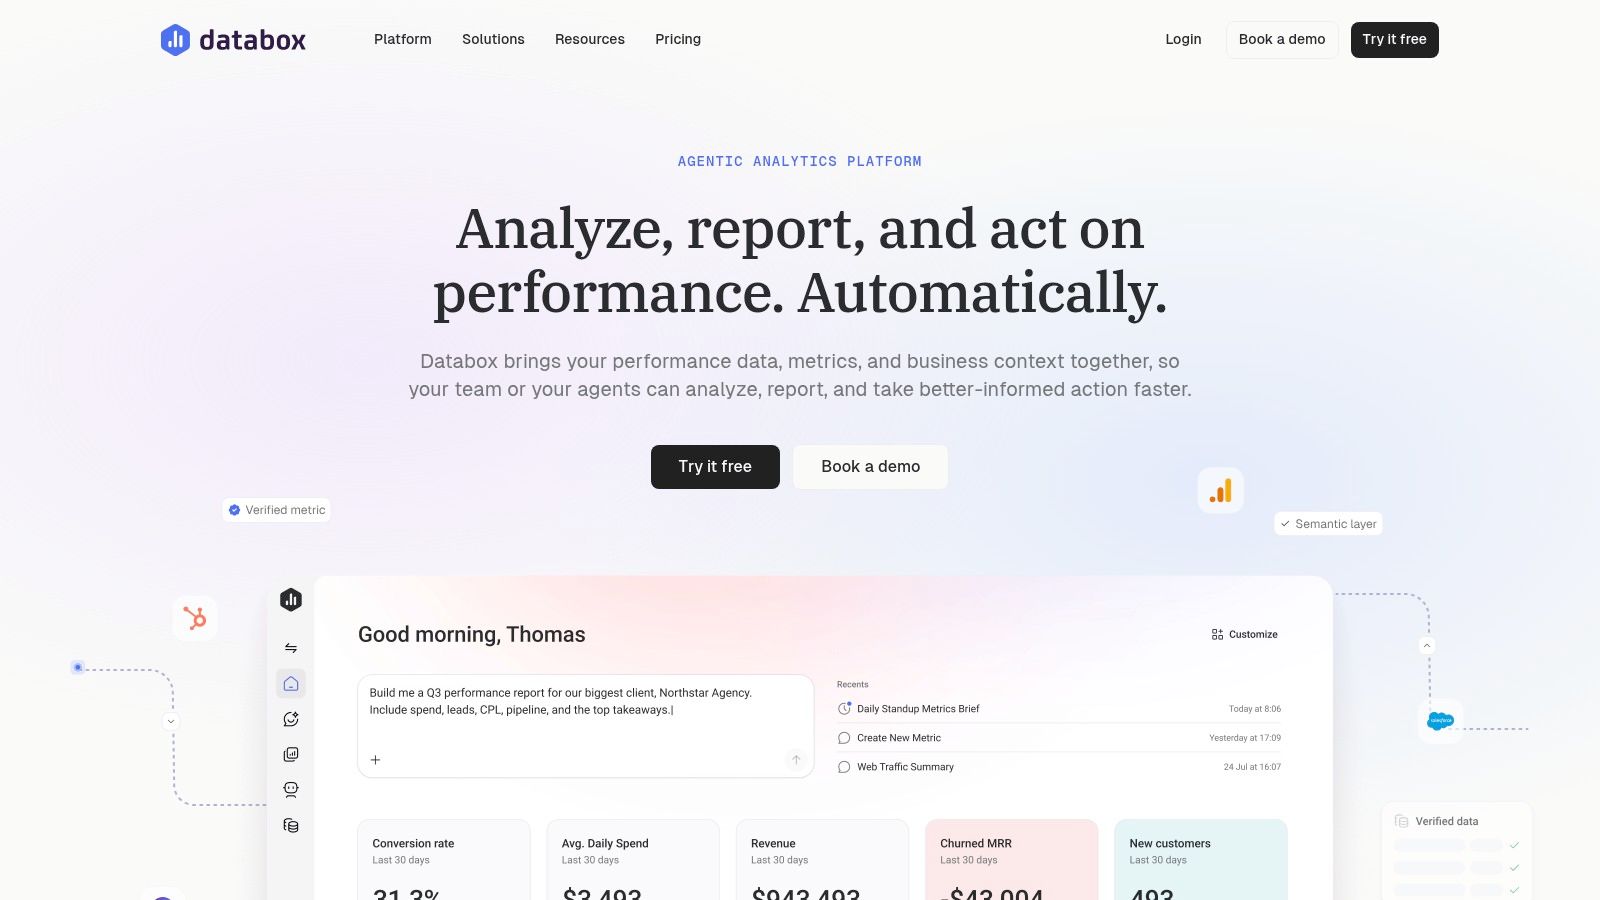
Databox is a display layer. It connects sources, then puts KPIs on dashboards and in reports, with custom metrics, goals, templates, sharing, and notifications. The free plan is intentionally small on sources, users, and dashboards. Paid plans open that up. It is more flexible than a subscription-only product when you want revenue, support, and a marketing number on one screen.
Flexibility does not create comparability. Databox will not decide whether MRR includes taxes, or whether an active user in your product tool matches a paid account in Stripe. You still publish the definition. If two widgets disagree, the dashboard did its job by making the disagreement visible. It did not fix the formula.
Lower plans cap sources, dashboards, or users, so a “free forever command center” usually isn't. It also isn't a substitute for subscription analytics or event-level product analysis. Treat it as the place the team looks, after the revenue tool and the product tool already agree.
For what “live” should mean once those sources are clean, see how a real-time metrics dashboard differs from a screenshot you update by hand.
9. Geckoboard
Geckoboard is the screen on the wall, or the link you send the team. Dashboards refresh automatically, pull from multiple sources, and are built to be seen, including on a TV. Higher tiers add alerts and drill-down into source records. Viewers can watch without editing, which is the right permission model for a metric you do not want twelve people redefining.
A wallboard repeats whatever you connected. If the source is stale, the screen is confidently wrong.
Geckoboard does not invent SaaS metric definitions, and it is a weak place to study user paths. You validate MRR and churn in the billing system, then display the result. Paid entry pricing is hard to justify when one person is tracking four numbers on a laptop. The product earns its cost when several people need the same live view and nobody should be exporting CSVs for a Monday standup.
Integration quality sets the ceiling. A failed sync should show an error, not yesterday's number dressed up as today. Use Geckoboard after the formulas are stable. Don't use it to discover what those formulas should be.
10. Google Analytics 4
Google Analytics 4 measures websites and apps in one property. It is event-based, so you can mark key events and conversions, then read traffic sources and journeys. For a SaaS founder, that is the acquisition question. Which channel produced the visit, and did that visit reach the signup or the pricing page.
GA4 is not a billing system. It should not be the source of truth for MRR, ARR, or churn. Those numbers live in subscription records. Tagging has to be correct or the journey report is a story about your container, not your customers. Many teams also still need a separate in-product tool, because marketing-site events and logged-in product events answer different questions. A public traction page is a third job again.
Keep GA4 for acquisition and site behavior. Send revenue questions to ChartMogul, Baremetrics, ProfitWell, or Maxio. Send in-app behavior to PostHog, Mixpanel, or Amplitude. If GA4, the product tool, and the billing tool disagree on “users,” write down the definition before you change the product.
Top 10 SaaS Metrics Software Comparison
| Platform | Core focus | Key capabilities | Best for | Value & standout point |
|---|---|---|---|---|
| ChartMogul | Subscription revenue analytics | MRR, ARR, churn, retention; combines billing sources | 👥 SaaS teams with subscription data across tools | 💰 Pro pricing scales with tracked ARR; ★ focused revenue reporting |
| Baremetrics | Subscription business health | MRR, churn, trials, segmentation, benchmarks, recovery add-ons | 👥 Subscription founders investigating revenue changes | 💰 Plans and add-ons vary; ✨ cancellation insights and payment recovery |
| ProfitWell Metrics by Paddle | Subscription revenue reporting | KPIs, cohorts, segments, industry benchmarks | 👥 SaaS teams seeking subscription insights | 💰 Core product free; ✨ benchmarks; free data refreshes every 3–6 hours |
| Maxio | SaaS financial operations | ARR/MRR, billing, collections, contracts, customer-level drill-down | 👥 B2B SaaS businesses with complex finance workflows | 💰 Contact sales for pricing; 🏆 combines reporting with billing operations |
| PostHog | Product analytics and developer tools | Events, funnels, replay, heatmaps, flags, experiments | 👥 Technical founders and developer-led teams | 💰 1M events/month free, then usage-based; ✨ broad product toolkit |
| Mixpanel | Web and mobile product analytics | Funnels, retention, flows, replay, feature flags | 👥 Product teams analyzing user behavior | 💰 Free up to 1M events/month; ✨ unlimited seats on free tier |
| Amplitude | Behavioral product analytics | Funnels, retention, cohorts, replay, experimentation | 👥 Product and growth teams exploring engagement | 💰 Free up to 2M events/month; ✨ combines analysis and experience tools |
| Databox | Cross-source KPI dashboards | Integrations, custom metrics, goals, reports, notifications | 👥 Teams monitoring mixed business KPIs | 💰 Limited free plan; ✨ brings multiple business metrics into one view |
| Geckoboard | Shared KPI dashboards | Auto-refreshing dashboards, data connections, TV display, alerts on higher tiers | 👥 Teams needing visible, regularly refreshed KPIs | 💰 Paid plans; 🏆 designed for team-wide KPI visibility |
| Google Analytics 4 | Website and app analytics | Events, conversions, traffic sources, user journeys | 👥 Founders measuring acquisition and site activity | ✨ Google ecosystem integration; use billing tools separately for MRR and churn |
Build a Stack You Can Trust and Share
Start with one revenue source of truth. Add one product analytics tool. Put a dashboard on top only after both layers refresh from named sources. Validating billing comes first, because a pretty MRR chart that ignores refunds, discounts, and annual contracts will train you to make the wrong call. Instrument a short list of events second. Activation, a core action, and a weekly return are enough until the definitions hold.
Standard SaaS KPIs get misused early. Much of the coverage pushes ARR growth, CAC payback, net revenue retention, the Rule of 40, and ARR per employee. The 2025 Benchmarkit dataset covered 563 SaaS companies and reported declining growth, rising acquisition costs, and flat NRR. Another 2025 benchmark drew mainly from U.S. B2B SaaS companies at $5–20 million in ARR. Those ranges help funded teams with sales staff. They poorly answer what meaningful traction is before $1 million ARR, or how to read self-serve activation, weekly active teams, open-source adoption, or usage-based revenue. The SaaS Barometer's latest metrics note is the place those benchmark limits show up. Don't force a pre-revenue or founder-led product into a later-stage scorecard.
Benchmark vendors also filter by size, ACV, pricing model, go-to-market motion, solution type, and location, which is an admission that the same KPI is not the same business. Baker Tilly's B2B SaaS benchmark report shows that filtering pressure. Educational posts still print clean formulas and skip source integrity. Does MRR match Stripe. Did the active-user definition change. Does churn exclude failed payments. Is the dashboard a snapshot or an event stream.
A metric audit trail is the practical fix. Write the definition, the source system, the refresh time, the cohort window, the exclusions, and a reconciliation check. More charts do not create more honesty. Provenance does. The same habit applies when you compare AI marketing analytics tools. Buy the layer that answers one question, and keep the formula visible.
Fundl fits after that stack exists. Connect Stripe, GitHub, and analytics, and publish a traction page that refreshes from those sources instead of a screenshot. Backers can see MRR, shipping, and activity with the source attached. You keep the explanation when your model doesn't match an enterprise benchmark.
Fundl turns a working metrics stack into a shareable traction page, pulling live MRR, product activity, and shipping signals from Stripe, GitHub, and analytics so backers see source-backed numbers instead of a static deck. If you are choosing SaaS metrics software and you want the revenue layer and the activity layer in one evidence page, set it up and share the URL. Visit Fundl when the definitions are stable enough to show.