
You've built a product, shared it in a few communities, and collected sign-ups. But it's still hard to tell whether anyone will use it twice, pay for it, or recommend it. The way to get early adopters isn't to maximize launch-day attention. It's to find people with an urgent problem, help them reach value, and make the evidence of that value easy to check.
Table of Contents
- The Early Adopter Playbook at a Glance
- Find the Users Who Feel the Problem Most
- Write an Offer Early Adopters Can Test Fast
- Reach Early Adopters Where They Already Talk
- Run a Small Cohort and Measure Real Activation
- Show Verifiable Traction Without Overstating It
- Launch Your Traction Page This Week
The Early Adopter Playbook at a Glance
A founder posts a beta link in two communities, watches sign-ups trickle in, and has no way to tell which of them will ever log in again. The playbook below treats each sign-up as the start of a filter, not a result. A real early adopter is someone who reaches value, comes back, and leaves evidence a stranger could check.
| Stage | Goal | Output | Typical window |
|---|---|---|---|
| 1. Target | Pick one narrow segment | Written segment profile | Week 1 |
| 2. Offer | Write a promise people can test | One-sentence offer with a perk or price | Week 1 |
| 3. Reach | Start real conversations in two channels | List of 30 named conversations | Weeks 1-2 |
| 4. Onboard | Get each user to first value | Activation rate by cohort | Weeks 2-3 |
| 5. Prove | Publish verified metrics | Live traction page with definitions | Week 3 |
| 6. Retain | Learn who comes back and why | Week-4 retention by cohort | Weeks 4-6 |
These stages overlap in practice. The windows are a working schedule for a solo founder building a first cohort of roughly 30 to 50 active users, not a guarantee that a product will reach that size on time. Progress is easier to assess through written outputs: a segment profile, a testable offer, a list of real conversations, an activation rate, and a traction page that explains its figures.
Use a stage gate: don't move on until you've produced the current stage's output. If you start promoting before you know whom the product serves and what users can test, you get attention without learning whether the product solves a clear problem.
The same discipline applies to counting. A signup is a response to an offer, while activation and return use are stronger evidence that someone is getting value. Weight your reporting accordingly, and measure the cohort before you celebrate the total. When you reach the measurement stage, a launch guide that covers how to track post-launch SaaS growth metrics can help you pick a short list of signals to watch after release.
Find the Users Who Feel the Problem Most
Rogers's diffusion-of-innovations model divides a population into adoption groups. It places innovators at 2.5% and early adopters at 13.5%. In a hypothetical market of 10,000 potential users, that works out to about 250 innovators and 1,350 early adopters, a theoretical pool of 1,600 people more willing to try something new. These are model categories, not guaranteed shares of any real market, as described in Rogers's diffusion framework.

Use the model as a prompt to narrow your search, not as a reason to market to everyone. Score candidate groups against three practical criteria:
- Urgency: Does the problem happen regularly, and does the current workaround cost time or money?
- Tolerance for rough edges: Does the person already use tools that require setup, manual steps, or workarounds?
- Peer visibility: Does the person talk about tools and experiments with others who have the same problem?
For example, a founder building a Stripe reconciliation tool could target freelance bookkeepers who close client books monthly in spreadsheets. A churn dashboard might start with solo SaaS owners who share public revenue updates and need a clearer view of cancellations. Those users have identifiable jobs and workflows, making conversations more useful than broad outreach to “small businesses.”
List about 20 communities or groups where people with the problem already gather. Score each against the criteria, then choose one place where the problem is frequent and people can assess your product directly. To turn observations into interview questions, Bazzly's guide to uncovering pain points with customer surveys offers a useful starting point. For a deeper validation process, use this guide to validating product-market fit.
Write a short segment profile before contacting anyone: role, trigger event, recurring task, and current workaround. “Freelance bookkeepers who reconcile Stripe payouts when closing client books, currently matching payouts to bank lines in spreadsheets” is specific enough to guide outreach and product decisions.
Write an Offer Early Adopters Can Test Fast
“An easier way to manage invoices” doesn't give a buyer much to picture. The offer could mean organizing receipts, chasing late payments, or preparing tax records. A stronger promise names who it serves, the task, the outcome, and the time or effort involved.
For example: “Freelancers who close their books monthly can reconcile Stripe payouts against bank lines in about 10 minutes.” That's a promise a prospect can judge after trying the product. If you can't describe the first useful action in one sentence, the offer may still be too broad.
Create two landing-page versions that test different promises, then send comparable traffic to each. Record visitor-to-signup, but don't pick a winner based on signups alone: check whether the resulting users activate and return. A Harvard Business School study of more than 35,000 global startups found that adopting A/B-testing technology was associated with a persistent 5% to 20% increase in page visits. The average gain was about 10% in the first few months, while firms with a year of experimentation showed gains ranging from 30% to 100%, according to the Harvard Business School study. Those findings concern page visits, not proof that a particular offer will convert or retain users.
Choose one incentive and cap how many people receive it. Each option offers a trade-off:
| Incentive | Works best when | Main risk |
|---|---|---|
| Founder-led lifetime discount | Price is part of the value and users trust the founder | Locks in low pricing and anchors future expectations |
| Early access with a feedback call | Users are technical and want real influence on the product | Feedback load grows faster than the user base |
| Extended free usage period | First value arrives soon after signup | Free users never convert and inflate the numbers |
| Public founding-member credit | Users build in public and like being seen | Weak motivation for private or internal tools |
| Roadmap voting | There's a clear next feature the segment is waiting for | Pulls attention away from the core workflow |
Reach Early Adopters Where They Already Talk
Start where your likely users already discuss the problem. Pick two channels to test, and match the channel to the product rather than choosing the one with the biggest audience.
| Channel | Best for | First test | Watch for |
|---|---|---|---|
| Niche communities, forums, Discord servers, subreddits | Developer tools and open-source projects | Answer questions for two weeks before pitching | Self-promotion rules and bans |
| Direct outreach to people with a known workaround | B2B tools and SaaS | Send 30 short messages that reference their specific workaround | Low reply rates unless each message is personal |
| Launch platforms | Consumer apps with a visual product | Prepare a demo video and a waitlist before launch day | One-day traffic spike with weak retention |
| Creator audiences, newsletters, YouTube, podcasts | Education products and AI tools | Offer a tracked discount code to one creator first | Audience mismatch with people who will pay |
In communities, spend time answering relevant questions before you mention your product. When you do bring it up, say plainly that you're the founder and follow the group's rules. Fundl's guide to community engagement can help you think through participation as a continuing practice rather than a one-off launch post.
For direct outreach, refer to the exact workaround the person described publicly, ask one useful question about it, and offer a product link only if they're interested. Don't send a copied pitch to a long list and call that customer discovery. The point of aiming for 30 real conversations is to gather a useful set of responses, not to treat a handful of replies as a verdict on an entire channel.
Avoid posting the same link in multiple places, pitching in threads about unrelated problems, or buying attention you can't verify. Those tactics can get you removed from communities or leave you with visitors who never had the problem in the first place.
Run a Small Cohort and Measure Real Activation
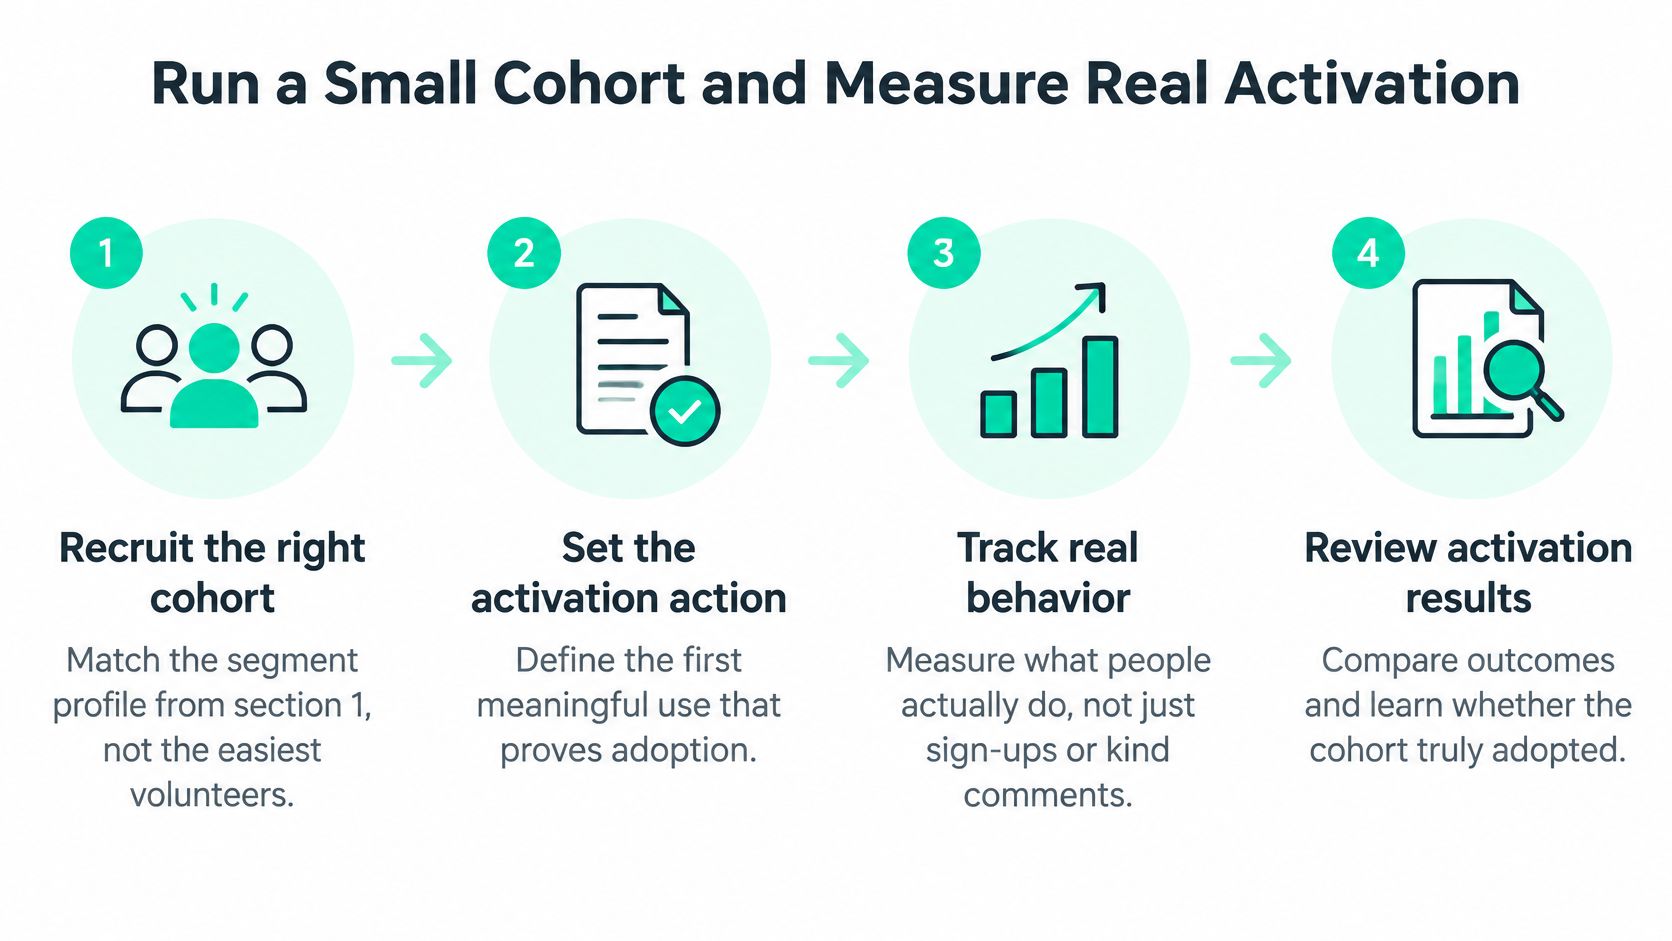
A kind comment or signup isn't adoption. Recruit testers who resemble the people you intend to serve, rather than only the easiest volunteers to reach. An NBER study found that beta-sample bias can have persistent effects on venture performance; one example was female-focused products launched on a platform whose users were roughly 90% male, which experienced 45% less growth over the following year. The finding illustrates why a mismatched test group can distort product decisions, as discussed in the NBER study of digital-product launches.
Run the cohort with a consistent process:
- Define first value. Name the action that proves a user got value, such as reconciling a payout or connecting a data source.
- Recruit to segment quotas. Make sure testers match the role, use case, and expected usage in your profile.
- Tag acquisition source. Record where each user came from so you can compare channels.
- Use the same onboarding. Keep the first experience consistent across the cohort.
- Track behavior. Measure time to first value, activation, week-4 retention, referrals, and willingness to pay.
- Interview non-activators. Ask people who signed up but didn't reach first value where they got stuck.
- Test again. Validate the pattern with a second cohort before changing positioning or roadmap priorities.
| Step | Metric it produces | Weak result means |
|---|---|---|
| 1. Define first value event | Time to first value | Median above 7 days points to a broken onboarding path |
| 2. Recruit to segment quotas | Share of cohort matching the profile | Under 80% points to a skewed pool |
| 3. Tag acquisition source | Activation rate by source | One source far below the rest points to a mismatched channel |
| 4. Run identical onboarding | Activation rate by cohort | Under a third reaching first value means onboarding is failing, not demand |
| 5. Track retention and referrals | Week-4 retention, referrals, willingness to pay | High signups with flat retention means enthusiasm, not adoption |
| 6. Interview non-activators | Stated blocker per user | One blocker repeated across interviews marks a fixable step |
| 7. Validate with a second cohort | Activation and retention repeated | Results that reverse mean the first cohort was unrepresentative |
If a third of signups never reach first value, investigate onboarding before concluding that the market doesn't care. For help choosing a primary metric and structuring measurement, Otter A/B's growth measurement guide for experimenters can support your analysis.
The strongest early signals aren't compliments. Look for repeat visits, specific feedback tied to a real task, unprompted referrals, and willingness to pay. Those behaviors help separate curiosity from users who keep finding a reason to return.
Show Verifiable Traction Without Overstating It
A stranger can't easily judge an unfamiliar product from a testimonial or screenshot. Both can leave important questions unanswered: when was the image captured, how was the number calculated, and does it represent typical use? More metrics don't automatically solve that trust gap. In Adobe's 2025 research, which surveyed 3,467 senior executives across nine regions, only 28% were confident in their measurement platforms, and 21% trusted personalization and recommendation engines, according to Adobe's customer-experience research. Use a small set of defined, checkable signals instead of a dashboard full of unexplained numbers.
Pick three signals that fit the product, and state the time window, calculation, and one limitation for each.
| Business type | Possible proof signals |
|---|---|
| SaaS | Monthly recurring revenue, active accounts, net retention |
| Developer tools | Weekly commits, repeat installs, issues closed |
| Education products | Completions, paid enrollments, returning learners |
| Consumer apps | Weekly active users, week-4 retention, sessions per user |
Add context where a figure could mislead. For instance, revenue that includes a single large annual plan tells a different story from recurring monthly payments. If a number is weak or volatile, say so in plain language instead of burying the limitation. Then check whether transparency brings in qualified signups, not just extra attention.
You can publish the proof on your own page or use a platform that pulls metrics from their source systems. Fundl can connect to Stripe for revenue, GitHub for commit activity, and analytics or other audience signals for audience size. Every project displays live, source-verified data from connected platforms, so backers can inspect the numbers before contributing. For a more detailed vocabulary for measuring product use, consult this guide to SaaS usage metrics.

The rule is simple: publish a number only if you can explain exactly how it's computed.
Launch Your Traction Page This Week
Day 1: Choose one segment and write its profile, including the role, trigger event, and current workaround. Keep it narrow enough that you can identify real people who fit it.
Day 2: Write your one-sentence offer and two landing-page versions. Each should make a clear promise a user can test, not just describe a list of features.
Day 3: List 30 specific people or relevant discussion threads where the problem appears. Day 4: Send your first personal outreach messages. Day 5: Answer questions in a relevant community and log each conversation, including what the person currently does and what they need to accomplish.
Day 6: Connect one useful metric, such as revenue or weekly usage, and write its definition in plain language. Day 7: Review how many conversations you started, how many people reached first value, and what you'll change next week. Publish the metric and its definition on one shareable page, then send that clean URL to the people you contacted.
A connected payment or code account can help refresh evidence, but you can start with a clearly defined metric on a simple page. Fundl's verified traction page is free to create and doesn't require backers; setting up a project takes about five minutes. Decide now which metric you'll review in four weeks, and what result would make you change the offer.
Fundl lets creators publish shareable traction pages with live, source-verified metrics, so potential supporters can inspect evidence rather than rely on promises. If you want to make your early progress easier to verify, visit Fundl and create a page for your project.