
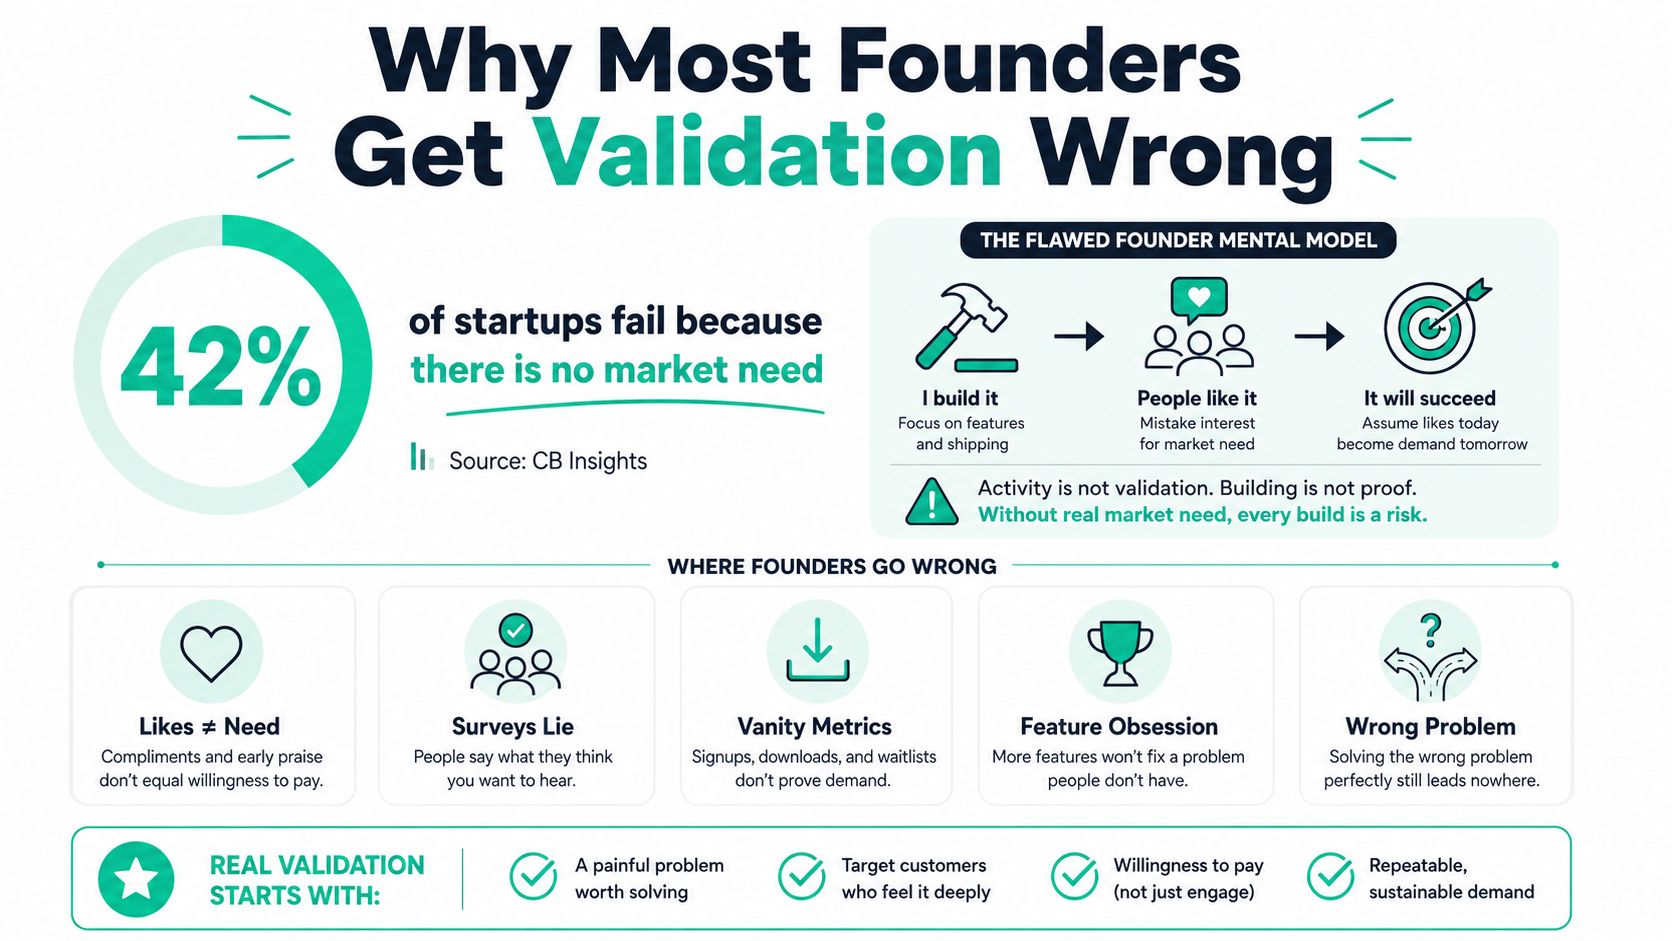
Forty-two percent of startups in one widely cited CB Insights analysis failed because there was no market need, making demand failure more common than many technical or funding explanations. The analysis and later coverage of updated CB Insights data point to the same uncomfortable conclusion: founders often spend too long improving products that customers never needed badly enough to keep.
To validate product market fit, stop treating it as a ceremonial milestone. Treat it as a continuous evidence loop. You'll write assumptions, test them with real people, observe repeat behavior, ask whether users would miss the product, and test whether they'll pay. Then you'll make a decision before enthusiasm, sunk costs, or investor pressure decide for you.
Table of Contents
- Why Most Founders Get Validation Wrong
- Writing the Hypotheses You Will Test
- Choosing Signal Metrics That Actually Matter
- Running Low-Cost Experiments Before You Build
- Turning Customer Interviews Into Real Evidence
- Reading the Results and Deciding What to Do Next
- Turning Live Traction Into Shareable Proof
Why Most Founders Get Validation Wrong
A polished product can still fail because the intended customer never needed it badly enough to change behavior. Founders often mistake shipping quality, friendly feedback, and launch activity for product-market fit. A clean interface shows that the team can build. It does not show that a specific customer has an urgent problem, will return to the solution, or will pay to keep using it.
The CB Insights finding puts that risk in concrete terms. In an analysis of 483 startup failures, 42% failed because there was no market need. Later reporting on updated CB Insights data cited 43% of failed VC-backed startups for poor product-market fit. The source summary supports a blunt operating rule: do not scale acquisition while the demand assumption remains unproven.
Replace confidence with an evidence loop
Confidence is not evidence. Neither are compliments from friends, unactivated waitlist names, or an audience agreeing with a feature that does not exist. Run validation as a recurring loop that combines the Sean Ellis survey, retention behavior, and willingness-to-pay tests. The survey can expose whether users would miss the product, retention shows whether the product earns repeat use, and payment tests reveal whether the problem carries economic urgency.
Use five disciplined moves:
- State the belief: Name the customer, painful job, and situation you expect to observe.
- Choose the evidence: Define the behavior, retention pattern, payment, or qualified survey response that would support it.
- Set the pass line first: Decide what result means continue, change direction, or stop.
- Run the cheapest credible test: Use interviews, a smoke-test page, a concierge service, or a paid offer before building fully.
- Record the decision: Weak results should change the next experiment, not become “interesting learning” with no action.
A live traction page can turn those signals into shareable proof for backers and peers, provided it displays real evidence rather than vanity metrics. Founders seeking a broader guide to validate product market fit can use it as a reference, but the standard remains yours: small experiments should create decisions, not a larger archive of ambiguous data.
Writing the Hypotheses You Will Test
Before code, ad spend, or a calendar full of interviews, write three statements. A useful hypothesis names a person, a situation, and an observable outcome. If someone else can't tell what result would disprove it, you haven't written a hypothesis yet.
Start with the problem
The problem hypothesis identifies the pain and its recurrence. “Freelancers need better tools” is too broad to test. “Independent designers lose project time when clients request feedback across disconnected channels” gives you a behavior to investigate.
Ask interviewees about recent events, not opinions about your concept. You're looking for evidence that the problem already causes workarounds, delays, expense, risk, or repeated frustration.
Narrow the customer
The customer hypothesis specifies the segment, role, and trigger that creates urgency. A scheduling product might target operations managers at service businesses after missed appointments begin affecting capacity. That's more useful than “small businesses,” because it tells you who to recruit and when the problem becomes active.
Describe the value as a behavior change
The value hypothesis states what users will do differently and what outcome should follow. “Our tool makes scheduling easier” is a slogan. “Operations managers will replace manual appointment coordination with a shared booking workflow and use it for every new request” is testable.
Use this template before each sprint:
| Hypothesis Type | Template | Worked Example (Scheduling Tool) |
|---|---|---|
| Problem | [Customer] experiences [pain] during [trigger], causing [consequence]. | Operations managers at multi-provider clinics lose appointment capacity when booking requests arrive through email and phone. |
| Customer | We believe [specific segment and role] has this problem often enough to seek a solution when [trigger]. | Clinic operations managers become actively dissatisfied with current scheduling after repeated double bookings or missed follow-ups. |
| Value | If we provide [specific mechanism], [customer] will change [behavior] and achieve [outcome]. | A shared scheduling workflow will replace fragmented coordination, helping managers assign appointments without back-and-forth messages. |
Add three controls to every line: sample, channel, and pass/fail rule. For example, recruit qualified operations managers through direct outreach, test the problem in interviews, and continue only if recurring stories show a current workaround and a clear cost. Don't select the threshold after hearing the answers. That turns a test into a justification exercise.
Choosing Signal Metrics That Actually Matter
No single metric confirms fit. Surveys reveal perceived dependency, retention reveals repeated value, activation shows whether users reach the useful experience, and payment tests reveal economic commitment. A strong read comes from convergence across different kinds of evidence, not from one attractive dashboard tile.
The Sean Ellis survey remains a practical starting point. When qualified users who have experienced the core value answer that they'd be “very disappointed” without the product, the commonly cited benchmark is at least 40%. Sean Ellis's benchmark came from analysis of about 100 startups and became influential because it made a vague question measurable. PMF Tracker's overview of the benchmark explains why the threshold is useful while also stressing that it isn't a natural law.
Use the survey carefully. Filter for people who have experienced the core value, used the product at least twice, and used it within the last two weeks. Practitioners commonly use at least 30 qualified responses for a directional read and 100 or more for a more reliable signal, as described in CRV's product-market-fit survey guidance. Calculate the score as very disappointed responses divided by valid responses, multiplied by 100, excluding “N/A” and lapsed users.
Compare the signal families
| Signal Family | What It Measures | Green-Light Threshold | Best Validation Stage |
|---|---|---|---|
| Sean Ellis survey | Perceived loss and dependency among qualified users | At least 40% very disappointed | After users have reached the core value |
| Retention behavior | Whether users return for the product's recurring job | A stable retention pattern that supports the use case | Once a usable cohort exists |
| Activation and conversion | Whether users reach value and move through the first-use path | A pass line defined for the specific funnel before testing | Smoke tests and early MVPs |
| Willingness to pay | Whether interest becomes financial commitment | Paid orders, deposits, or a paid waitlist meeting the prewritten rule | Before substantial build or scale |
A guide from IdeaProof's PMF framework describes a stronger operational pattern as sustained 40% or more very disappointed responses, organic growth above 15% month over month, and net revenue retention above 100% for at least three months. Treat those as a combined framework, not a universal law. The same guide discusses 5% to 7% monthly churn as a rough upper marker in B2B SaaS and 80% to 90% monthly retention as a strong signal, but your product's usage cycle still determines what “retention” means.
Don't use NPS as a substitute for dependency. A user can recommend a product politely and still abandon it. Track the core action, return behavior, and money alongside survey responses. If your funnel needs work, use this practical resource on improving conversion rates. When you're preparing a fundraising narrative, you can also browse an early stage VC database to understand which evidence investors may expect, but don't let investor preferences replace customer evidence.
Running Low-Cost Experiments Before You Build
Build the smallest test that can answer the next decision. A landing page can test a promise. A fake door can test feature demand. A concierge MVP can test the service outcome. A pre-sale can test whether the outcome matters enough for someone to commit money.
Use an effort ladder
Smoke-test landing page: Write a narrow promise, send targeted traffic, and measure qualified sign-ups or a clear call to action. Define the audience before buying traffic. A page that attracts broad curiosity but no target users has weak evidence.
Fake-door feature test: Place a proposed feature inside an existing product, community, or workflow. When someone clicks, explain that access isn't available yet and ask for a commitment such as an interview, waitlist registration, or deposit. Don't pretend a nonexistent feature works. Test demand without misleading people.
Concierge MVP: Deliver the result manually. A scheduling founder might coordinate appointments through a shared spreadsheet and email while observing where conflicts occur. Manual delivery exposes the job before automation hides it behind a feature list.
Gated pre-sale: Ask for a deposit or paid order before writing the full product. This is the strongest early filter because a promise has become a financial decision.
Make every experiment answer one question
Suppose a founder spends $500 on Meta ads and sends traffic to a landing page with email capture. The founder's stated target is a 12% or higher conversion rate before building. Those figures are part of the experiment design, not proof that the product has demand. The founder still needs to inspect who converted, whether the message attracted the intended segment, and whether those people will take a deeper action.
| Experiment | Primary Metric | Minimum Sample | Pass Threshold | Typical Cost |
|---|---|---|---|---|
| Smoke-test page | Qualified conversion | Predefined before launch | 12% or higher in the worked example | Paid traffic budget |
| Fake door | Clicks followed by a meaningful commitment | A defined stream of target visitors | Prewritten commitment rate | Low, if an existing channel is available |
| Concierge MVP | Completion and repeat requests | A small target-user cohort | Repeat demand and acceptable delivery effort | Founder time and basic tools |
| Pre-sale | Paid commitments | Target accounts or buyers | Prewritten deposit or order rate | Payment and sales tools |
The cost column stays qualitative because cost depends on channel, geography, and the offer. Community participation can help recruit the right testers, and these community engagement strategies can support that work, but don't mistake audience activity for validation. Stop, revise, or advance after each experiment. Don't run all four because the checklist says so.
Turning Customer Interviews Into Real Evidence
A founder running six interviews should behave like an investigator, not a presenter. The product stays out of the conversation until the participant has described a recent problem, the workaround, and the consequences of leaving it unresolved.
Start with this script:
- “Tell me about the last time you handled this task.”
- “What happened from start to finish?”
- “What did you use to manage it?”
- “What was frustrating or expensive?”
- “Have you tried to change the process?”
- “What caused you to look for an alternative?”
- “Who else is involved in the decision?”
- “What did you pay for or give up to solve it?”
Only after those questions should you show a concept, and even then, ask what they would replace rather than whether they “like” it.
Separate evidence from encouragement
A participant who says “I'd definitely use that” may be trying to be helpful. Politeness bias appears when the person agrees with your framing but can't recall a real incident. Hypothetical enthusiasm appears when the participant promises future action without changing anything today. Solution attachment appears when the founder starts defending a feature instead of investigating the job.
Score each interview from low to high on four dimensions:
- Severity: Does the problem threaten revenue, time, quality, or reputation?
- Frequency: Does it recur in the participant's normal workflow?
- Current alternative: Are they already paying, improvising, or assigning staff to handle it?
- Payment signal: Have they paid for a related solution or offered a concrete buying path?
Write the score immediately after each call. Don't rely on memory, and don't count a flattering quote as a pass.
Turn patterns into product decisions
Suppose three of six interviewees independently describe copying appointment details between email and a calendar. That repeated workaround is stronger evidence than a feature request invented during the demo. Build the first test around removing that specific handoff, then return to the same users and observe whether the behavior changes.
Interview rule: Ask about the last real event, not the participant's opinion about your future product.
Six interviews won't prove a market. They can expose a bad segment, reveal the language customers already use, and identify the behavior your first experiment must change. The founder's job is to convert those observations into a narrower hypothesis, not to collect a folder of quotable praise.
Reading the Results and Deciding What to Do Next
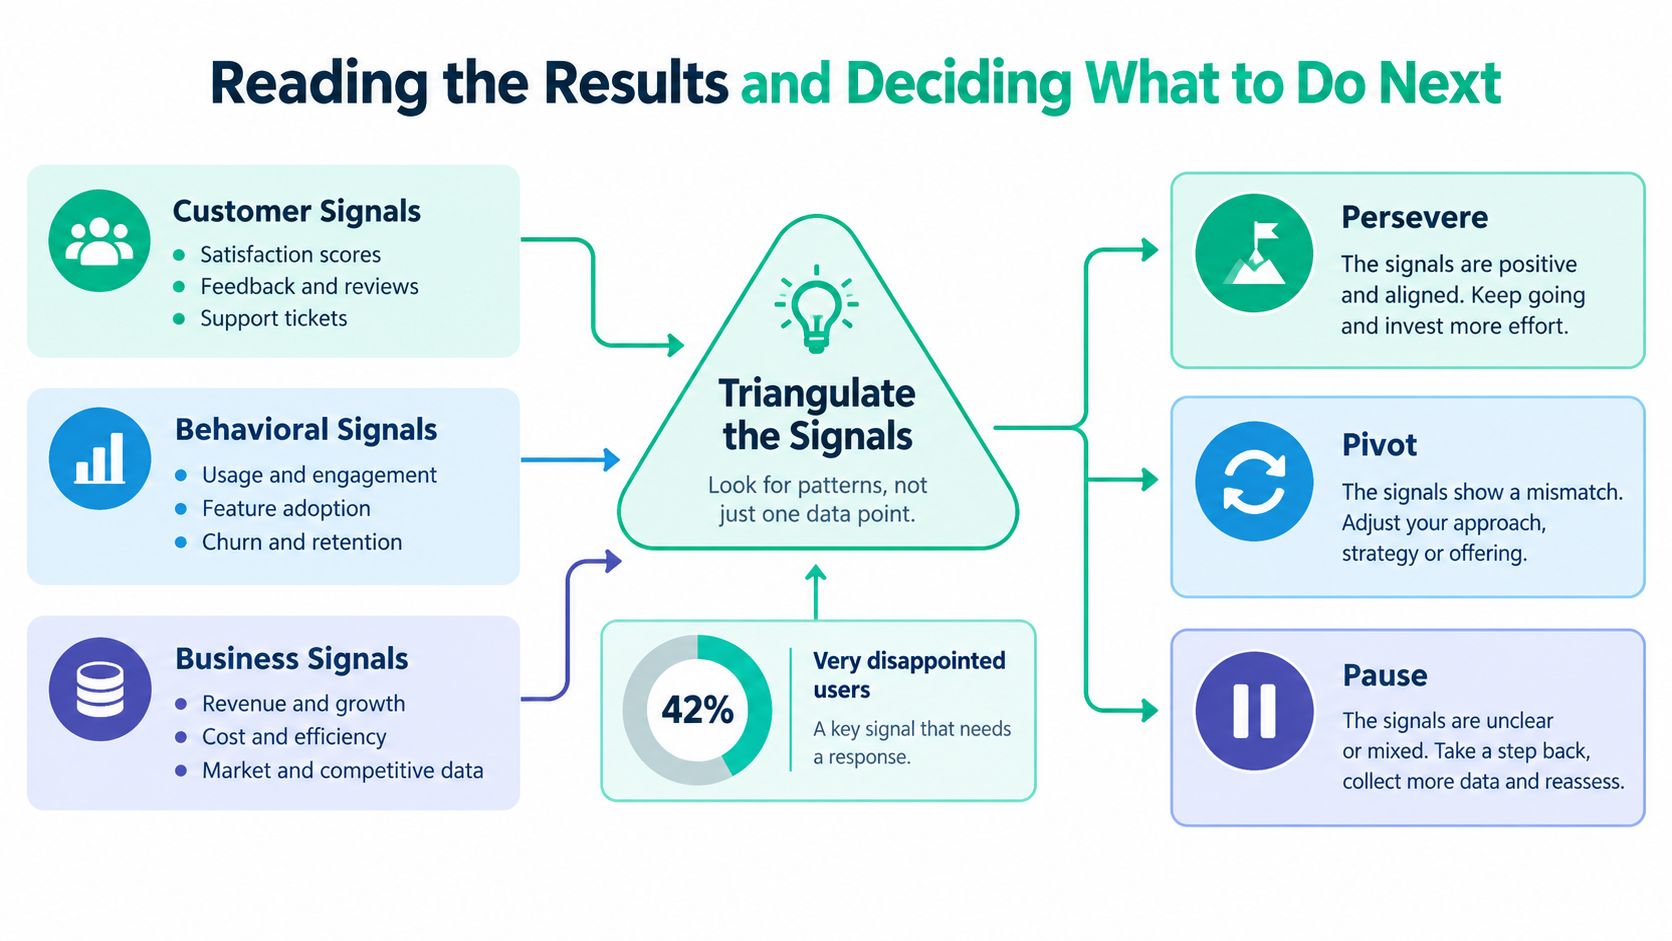
Triangulation prevents a single impressive result from overruling contradictory behavior. Consider a product with 42% of surveyed users saying they'd be very disappointed without it, 38% week-four retention, and a 9% pre-sale conversion rate from targeted accounts. The survey clears the widely cited Sean Ellis benchmark, but the complete picture is mixed.
The survey says a meaningful group perceives strong value. Retention shows that many users aren't continuing into the later experience, while the pre-sale result shows some commercial interest among the targeted accounts. The correct response isn't automatic scaling. Investigate why the users who report dependency aren't returning, and examine whether the paying accounts share a use case that the broader user group doesn't.
Use convergence, not averages
A simple decision matrix keeps the team from turning one green cell into a growth mandate:
| Survey | Behavior | Money | Decision |
|---|---|---|---|
| Strong | Strong | Strong | Persevere and test controlled growth |
| Strong | Weak | Strong | Focus on retention, onboarding, or the wrong use case |
| Weak | Strong | Strong | Narrow the segment or improve the promise and survey sample |
| Strong | Strong | Weak | Rework packaging, pricing, or buyer access |
| Weak | Weak | Weak | Pause, kill the approach, or test a new segment |
The matrix is a decision aid, not a substitute for judgment. Two or more strong signal families support continued investment, while mixed results point to the weakest dimension. If every signal misses its pass line, stop polishing the product and revisit the customer, problem, or value proposition.
A useful operational loop combines the survey with retention curves and direct qualitative research. Harvard Business Review's discussion of real-world PMF validation highlights the gap between one-time feedback and ongoing evidence. Your review should include cohort behavior, the core action, payment behavior, churn reasons, and the exact segment producing the strongest results.
The worked example is therefore a focused pivot or investigation, not a green light. Ask the 42% group what value they rely on, compare them with retained users, and test a paid offer to that narrower profile. Then rerun the loop with a new pass/fail rule.
The following video provides another visual explanation of how product teams can interpret evidence before committing to scale.
Turning Live Traction Into Shareable Proof
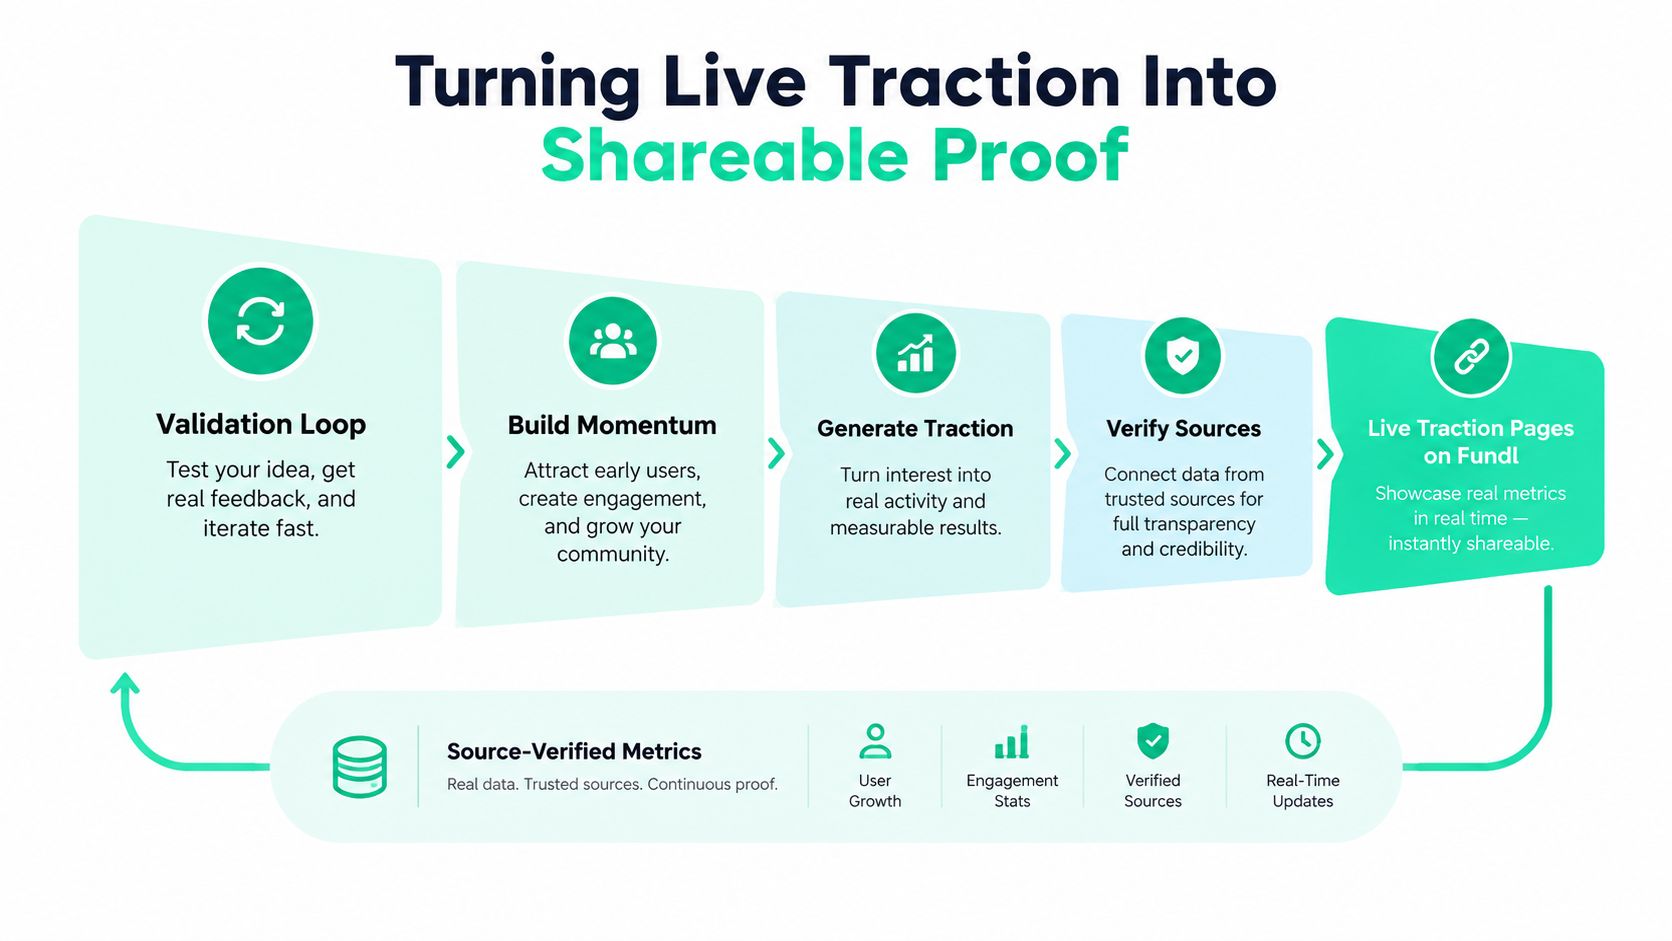
Validation becomes more useful when the evidence remains visible after the experiment ends. A live traction page can collect the signals that otherwise sit across survey exports, payment records, analytics dashboards, and interview notes. The page isn't the evidence itself. It is the organized, inspectable layer that lets backers, peers, accelerators, and investors see how the evidence changes.
Map each signal to proof
Use one page to answer four questions:
- Do people care? Show the qualified Sean Ellis result with the survey population and filter criteria.
- Do they return? Display retention by cohort and define the core action.
- Do they reach value? Show activation and conversion through the first-use path.
- Will they pay? Report pre-orders, deposits, or paid waitlist conversion with the audience definition.
Context matters as much as the number. Label the period, cohort, event definition, and source. “Retention” means little without knowing what counts as active. “Sign-ups” can mislead if the page doesn't distinguish a visitor from a qualified user who completed the core action.
A screenshot is a frozen claim. Source-connected metrics offer a stronger record because someone can inspect how the figure was produced and whether it updates. Fundl is one option for publishing a shareable traction page that connects data sources such as Stripe, GitHub, and analytics, with metrics that refresh as the project changes. It supports reward-based contributions processed through the creator's Stripe account, rather than equity fundraising.
Publish the decision trail
Feature the strongest signal first, but don't hide the weak one. A backer can accept early retention friction when the founder explains the onboarding change, the affected cohort, and the next test. They'll distrust a page that presents a polished total while avoiding the behavior underneath it.
Refresh the page whenever a meaningful experiment closes, not whenever the founder wants a promotional moment. A live record can show that a pre-sale test led to a segment change, that activation improved after a workflow change, or that retention contradicted survey enthusiasm. This turns validation into a continuing narrative rather than a one-time announcement.
Founders also need a funding plan that matches the evidence. This guide to getting startup funding can help frame the next raise or contribution campaign around traction instead of unsupported forecasts.
Follow a 30-60-90 day execution plan
Days 1 to 30
- Write the problem, customer, and value hypotheses.
- Define a pass/fail rule before collecting responses.
- Build the smoke-test landing page.
- Run targeted traffic or direct outreach.
- Complete the first five customer interviews with a non-leading script.
- Record severity, frequency, alternatives, and payment signals.
Days 31 to 60
- Send the Sean Ellis survey only to qualified users.
- Run a pre-sale, deposit, or paid waitlist test.
- Deliver one gated MVP experiment to a small cohort of paying users.
- Compare what users said with what they did.
- Rewrite the weakest hypothesis, not the entire product by reflex.
Days 61 to 90
- Review retention, activation, survey responses, and willingness to pay together.
- Document a persevere, pivot, or pause decision.
- Publish the strongest verified metrics on a live traction page.
- Add explanatory context for each cohort and metric.
- Schedule the next evidence review before returning to feature work.
Watch the recurring failure modes. Friends give encouragement instead of market evidence. Participants express polite enthusiasm without changing behavior. Vanity sign-ups disguise weak activation. Founders alter survey interpretation after seeing disappointing results. Teams also skip the pass/fail rule, which lets every result sound positive.
Founder standard: If the evidence can't change your next decision, you probably didn't design an experiment.
Start tomorrow with one customer segment, one painful job, and one payment or behavior test. Then publish what happened, including the result you hoped not to see.
Fundl gives founders a way to publish shareable traction pages with live, source-connected metrics, so your product-market-fit evidence can stay current instead of living in screenshots and pitch decks. Visit Fundl to connect your traction data, set a funding goal, and invite backers to evaluate the evidence directly.