

In 2025, fewer than 25% of companies in High Alpha's SaaS benchmark survey of more than 800 respondents used KPIs or dashboards to quantify impact. Teams still decide from memory, a slide, or a screenshot. A startup metrics dashboard only earns its place when every number carries a definition, a source, a window, and a limit on who should see it. Freshness is the easy part. Provenance is what makes a number safe to act on.
Table of Contents
- What a Startup Metrics Dashboard Really Does
- The Core KPIs for SaaS and Creator Products
- How to Lay Out Live Traction Without Clutter
- Turning Commits Into a Credible Shipping Signal
- Knowing Which Numbers Are Decision-Grade
- Dashboard Examples for Indie Hackers and Small Teams
- Publishing Metrics Without Exposing Your Business
- Build Your First Dashboard This Week
What a Startup Metrics Dashboard Really Does
A startup metrics dashboard is one shared view of the few numbers that show whether a product is gaining users, keeping them, and earning money. Think of a car's instrument panel. Speed, fuel, and engine temperature sit in front of the driver because those readings should change a decision. Oil pressure in a buried sensor does not. The same rule applies here. Total page views, social followers, and a climbing signup counter can fill a screen without telling you whether anyone stayed.
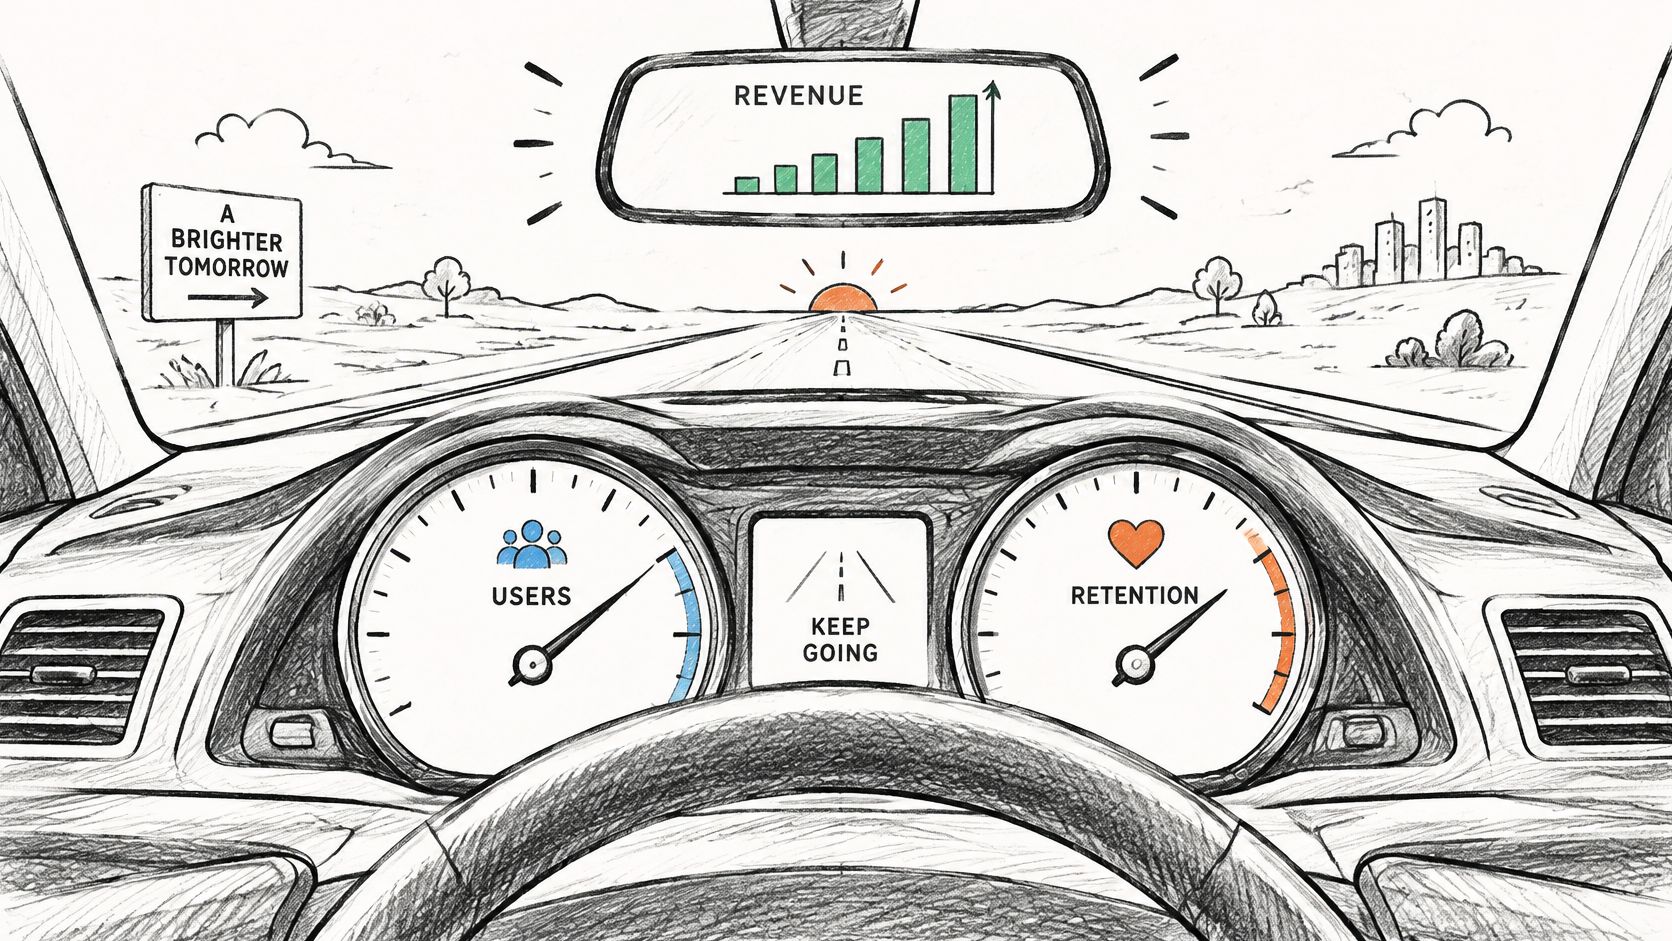
The reason for that restraint is old and blunt. In CB Insights' analysis of 101 startup post-mortems, published in 2018, “no market need” was the most cited cause, at 42%. The same analysis found that 29% ran out of cash. A founder who only watches signups can look busy while activation stays weak and churn arrives in the second month. Cohort retention and recurring revenue are the gauges that show whether demand lasts long enough to matter.
Say a notes app hits 2,000 signups in six weeks. The panel that only shows that total looks healthy. Split the same people by signup week and you may find that week-one users are already gone, while the people who created a second note are the only ones still opening the app. That split is the dashboard doing its job.
Write one sentence before you add a tile: “This view must tell me whether paying customers are still here next month.” If a number cannot change that answer, leave it off.
The Core KPIs for SaaS and Creator Products
Six numbers cover most early SaaS and creator products. Each one below has a formula, a review cadence, and a decision it is allowed to change. A longer treatment of how these fit a subscription business sits in our guide to SaaS growth metrics.
| KPI | How it is calculated | Typical review cadence | What it tells you |
|---|---|---|---|
| MRR | Sum of monthly recurring subscription revenue, with annual plans divided by 12 | Daily or weekly | Whether recurring revenue is growing |
| Churn rate | Customers lost in the period divided by customers at the start of the period | Monthly | Whether paying users are staying |
| MAU | Unique users active in the last 30 days | Weekly or monthly | Size and direction of the active audience |
| Activation rate | New users who reach a named first-value event divided by new signups | Weekly | Whether onboarding delivers value |
| CAC | Total acquisition spend divided by new paying customers in the same period | Monthly | Whether growth spend is efficient |
| Weekly commits | Commits merged to the main branch in the week | Weekly | Build activity only, not proof of demand |
Definitions that change the number
MRR is not “whatever Stripe charged this month.” Divide annual plans by 12, and state whether refunds and discounts are already netted out. A $1,200 yearly plan is $100 of MRR, not a spike.
Churn needs two versions. Customer churn is logos lost divided by logos at the start. Revenue churn is recurring dollars lost divided by starting MRR. Five small cancellations can look worse in the count than one large account that left without notice.
MAU needs a fixed window, usually the last 30 days, and a written meaning of “active.” A login is not the same as a completed action. Pick one and keep it.
Activation names one first-value event, such as a project created or a first course lesson finished. A vague “engaged” label cannot be audited.
CAC uses the full acquisition spend in the same period as the new paying customers, including ads, tools, and the time you pay for. Leaving out contractor fees makes growth look cheaper than it is.
Weekly commits are a build signal. They do not prove anyone wants the product.
Creator products and the selection rule
A course or download business swaps some of these tiles. Revenue per launch, repeat buyers, and audience growth answer whether a drop found buyers and whether those buyers came back. The selection rule is the same for both models. A KPI earns a tile only if a decision changes when it moves. Start with three to five.
Say a product opens March with 40 paying subscribers and 3 cancellations. Monthly customer churn is 3 divided by 40, or 7.5%. That single month is a flag, not a verdict. You still need the next two months, and the revenue version of the same loss, before you rewrite pricing.
How to Lay Out Live Traction Without Clutter
A dashboard can show four layers of traction in six to eight tiles. Order the layers by what they measure, and give each number a clear source and time window.
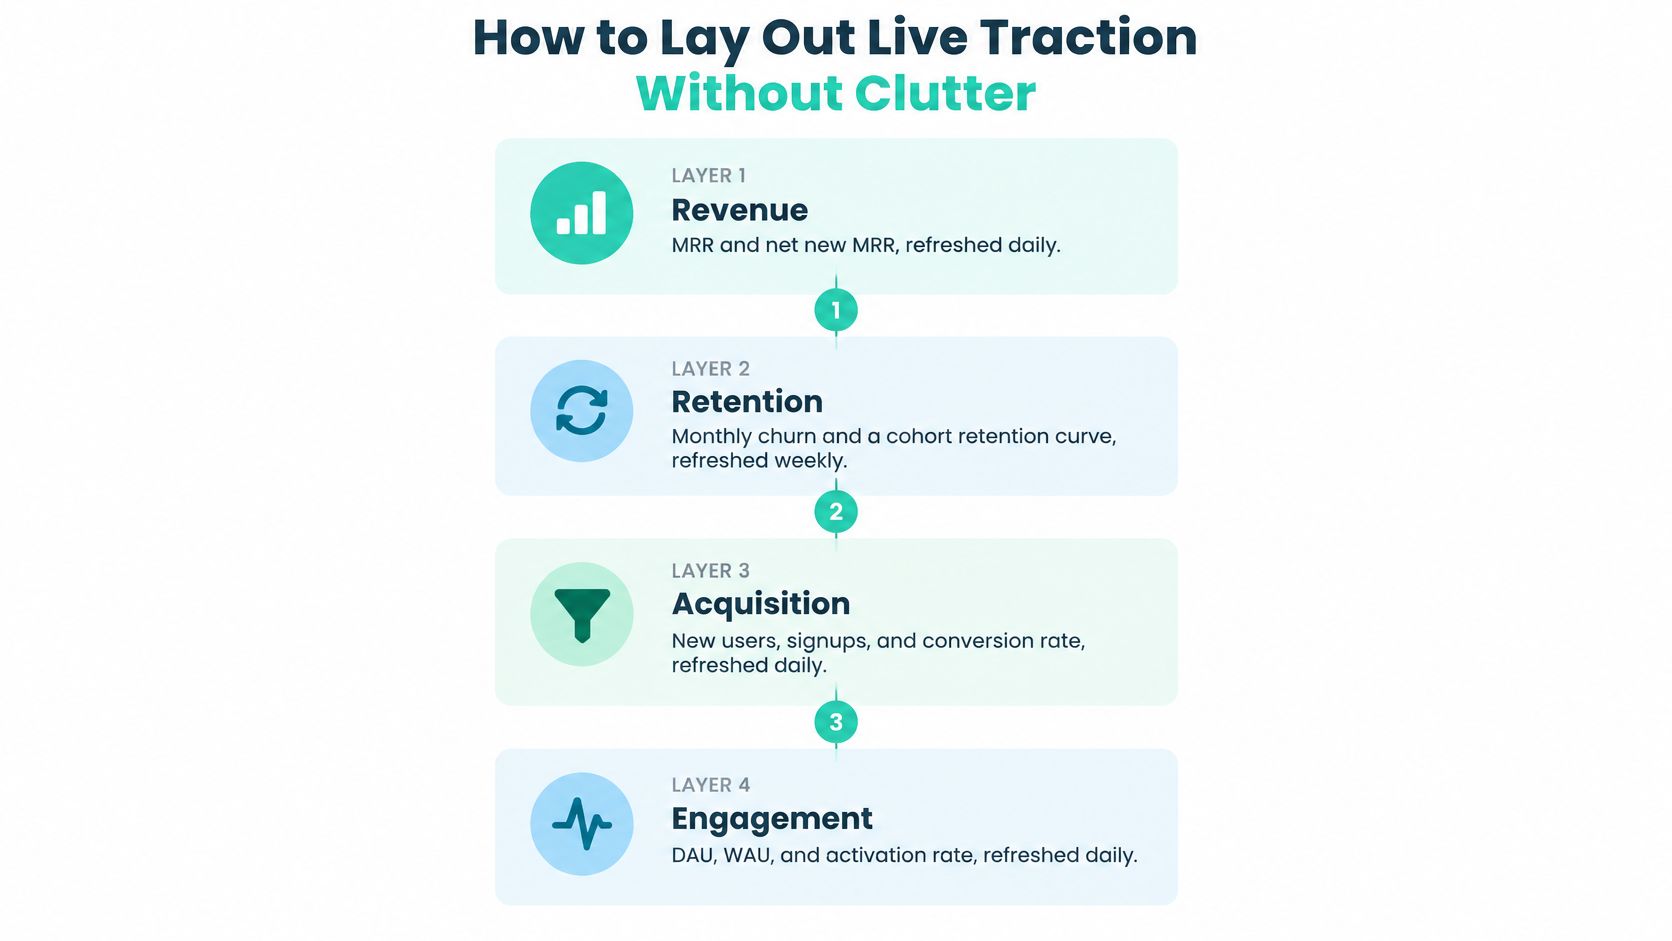
- Revenue. Show MRR and net new MRR, refreshed daily. Give revenue the most visual space if funding or pricing decisions depend on it. State which connected source supplies the figures.
- Retention. Show monthly churn and a cohort retention curve, refreshed weekly. Define the customer group and period behind each measure.
- Growth. Show MAU and activation rate, refreshed weekly. Name the event that qualifies someone as active or activated.
- Build. Show weekly commits and production deployments, refreshed weekly. These indicate development activity and releases, not customer demand.
A current value alone cannot show whether a metric is rising, flattening, or reversing. Plot each measure over an eight-to-twelve-week window and date-stamp the display. Mark releases, price changes, and campaigns on the timeline, while making clear which platform or account supplies each number. Freshness helps readers see what changed; provenance and definitions help them judge what the change means.
Most startups do not last long, so a snapshot is a weak record of whether a business is working. Compare MAU with MRR to distinguish audience growth from monetization, and read the cohort curve before judging a launch. For campaign measures, how to measure marketing performance offers a useful frame: connect each channel to a change you can observe over time.
Practical rule: If you cannot identify when a metric moved and which release or campaign coincided with it, the chart needs clearer context.
A short walk-through of reading a live traction page, rather than a pitch slide, is here:
Sketch the four layers before opening a dashboard tool. Assign one metric to each tile, then add another only if it answers a distinct question and has a clear source and definition.
Turning Commits Into a Credible Shipping Signal
A raw GitHub commit count is a poor proof of progress. Bots, formatting passes, and staging branches can raise the number while users see nothing new. The DORA framework splits throughput from instability, which is the split a shipping layer needs. A practical mapping of those measures onto a public repo is in our note on GitHub and DORA metrics.
| Metric | Formula | Exclude from count |
|---|---|---|
| Deployment frequency | Successful production deployments divided by the selected period | Staging, preview and failed deployments |
| Change lead time | Elapsed time from commit to successful production deployment | Automated bot commits and reverted changes |
| Change failure rate | Failed or remediated deployments divided by total production deployments | Duplicated deployment records |
| Failed-deployment recovery time | Elapsed time from a failed deployment to restored service | Non-production incidents |
What each measure is allowed to claim
Deployment frequency counts successful production releases in the window you chose. Weekly commits can show that someone is working. Frequency shows whether that work reached users.
Change lead time is the elapsed time from commit to a successful production deployment. A busy week with a 20-day lead time is a queue, not momentum.
Change failure rate is failed or remediated production deployments divided by all production deployments. High output with a rising failure share is acceleration that may be hurting reliability. Keep the rate and the failure share on separate trend lines so one cannot hide the other.
Failed-deployment recovery time is how long it takes to restore service after a failed production deployment. Speed of repair is part of the shipping story, not a footnote.
The exclusions that keep the signal honest
Each metric needs an explicit numerator, denominator, time window, environment, and source timestamp. Then cut what inflates it.
- Duplicates: Count a deployment once, even if the pipeline logged it twice.
- Reverts and bots: A reverted change and an automated commit are not user-facing work.
- Non-production: Staging, preview, and local runs stay off the production rate.
- Wrong incidents: A staging outage does not belong in recovery time.
Write a one-line definition for each of the four before the tile goes live. If the line cannot name the environment, it is not ready.
Knowing Which Numbers Are Decision-Grade
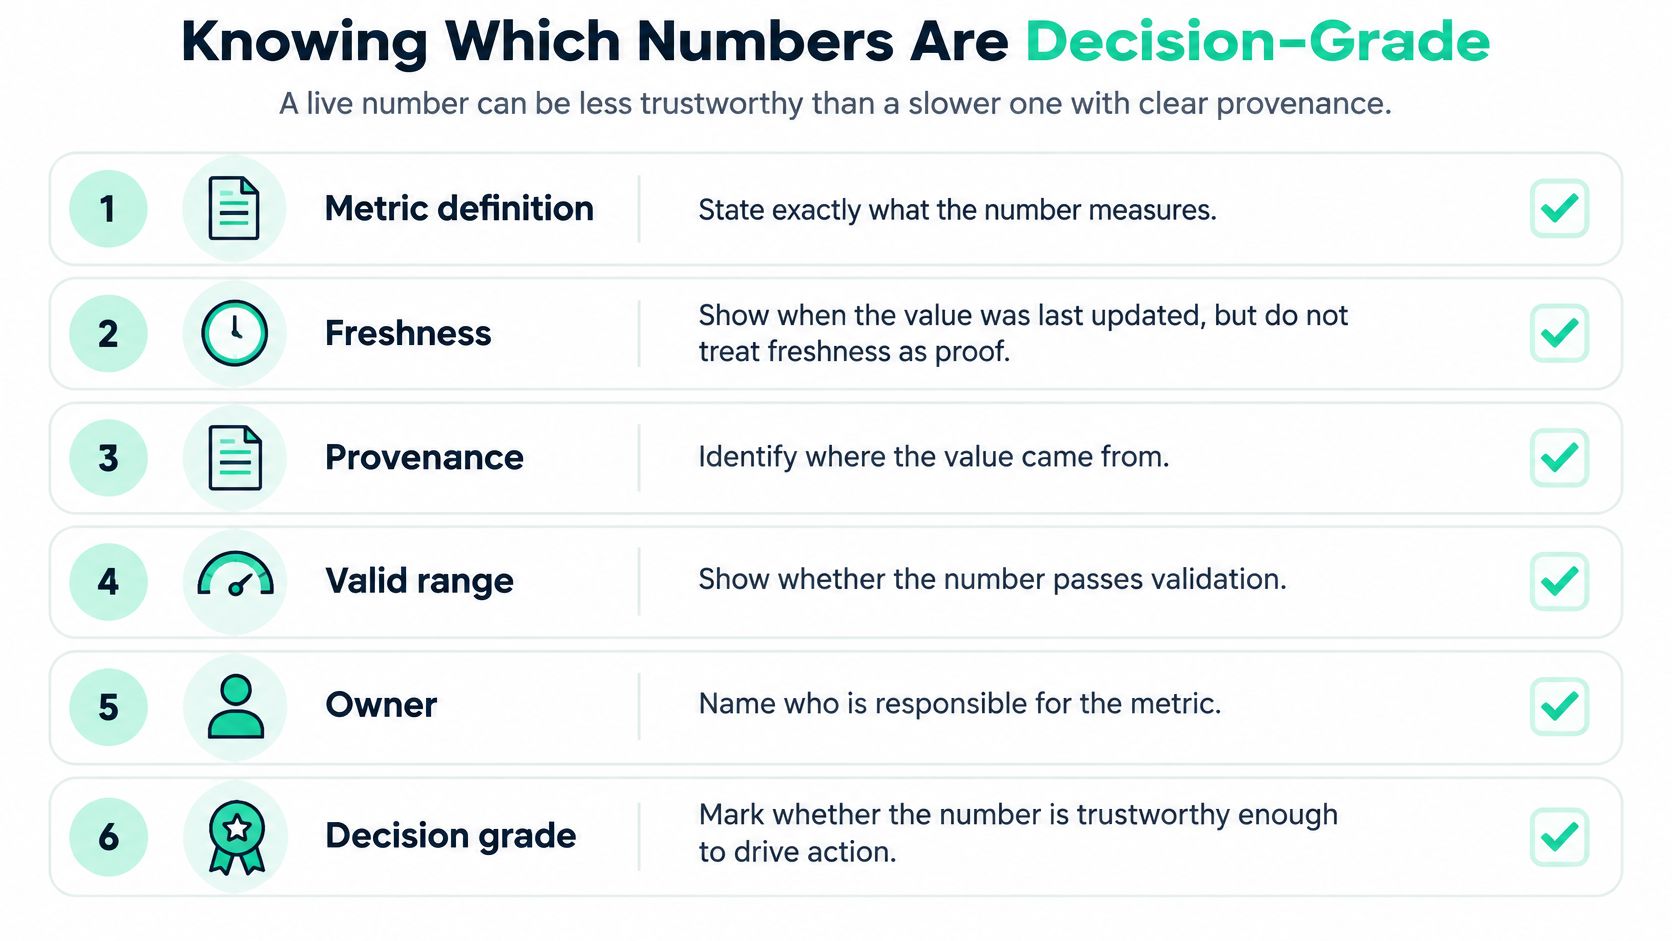
A live number can be less trustworthy than a slower one with clear provenance. Freshness does not establish validity. Launch List's startup metrics guidance is typical of the genre: it points founders at a compact weekly set, often visitors, signups, activation, retention, MRR, churn, and CAC, and then stops. It rarely says what to do when the sample is tiny, the events are missing, or two tools disagree.
Questions the tile has to survive
Who counts as active when one person uses two products? Pick the product boundary and the event. Do not add the two logins and call it two users.
Is a one-customer MRR change growth? Show the count beside the percentage. Moving from one paying customer to two is a 100% rise that should not drive a hiring plan.
What did you do with messy money and messy traffic? Refunds, annual plans, free trials, bot traffic, and missing events each need a rule. A trial that never paid is not MRR. A bot is not MAU.
Small samples make percentages swing. Put the numerator and the denominator on the tile, plus the cohort window and the sample size.
A flag, not a vibe
Every value should carry its definition, source, refresh timestamp, cohort window, sample size, and a simple data-quality flag such as complete, partial, or delayed. Our metrics come from connected creator accounts, not from manual screenshots. Every project shows live, source-verified data pulled from those platforms, and backers can see the numbers before they back. Stripe can feed revenue, GitHub can feed commits, and an analytics tool can feed audience size. The connection is what lets someone check the figure instead of trusting a cropped image.
Before a tile goes live, run this list:
- Definition: One sentence, including exclusions.
- Source: The system of record, not a paste.
- Timestamp: When this value was last refreshed.
- Window: The dates the numerator and denominator cover.
- Sample size: The count under the percentage.
- Flag: Complete, partial, or delayed, in words a backer can read.
If any line is blank, the number is not decision-grade yet.
Dashboard Examples for Indie Hackers and Small Teams
These four layouts are illustrations, not benchmarks. Copy the nearest row, then delete any panel that does not answer that row's question.
| Stage | Core panels | Refresh cadence | Headline question |
|---|---|---|---|
| Pre-revenue solo builder | Waitlist size, activation rate, weekly active users | Weekly | Are people reaching first value? |
| Early paying indie SaaS | MRR, net new MRR, monthly churn, activation rate | Revenue daily, product weekly | Is revenue growing faster than churn? |
| Small team with paid product | MRR, MAU, CAC, deployment frequency, change failure rate | Weekly | Which channel and release drive paid growth? |
| Creator course business | Revenue per launch, repeat buyers, audience growth | Weekly | Do buyers return for a second product? |
Pre-revenue solo builder
Revenue does not exist yet, so it should not dominate the page. Waitlist size shows interest. Activation rate shows whether people who join reach a named first action. Weekly active users show whether that action repeats. The only question is whether strangers reach first value without you in the room.
Early paying indie SaaS
Add MRR, net new MRR, and monthly churn, and keep activation so new logos are not the whole story. Read net new MRR against churn in the same month. If new revenue only replaces what left, you are replacing customers, not growing.
Small team with a paid product
CAC joins the revenue tiles, and deployment frequency sits next to change failure rate. The question narrows to which channel and which release produced paid growth you would repeat. A cheap channel that feeds a failing release is not a win.
Creator course business
Launches are lumpy, so a single MRR line can mislead. Revenue per launch, repeat buyers, and audience growth answer a different question: did buyers come back for a second product, or was the first sale a one-time spike? Audience growth without repeat buyers is a list, not a business.
Find your nearest row, copy its panels, and drop any tile that does not answer the headline question. A pre-revenue page that leads with CAC is answering a question you do not have yet.
Publishing Metrics Without Exposing Your Business
More transparency raises credibility only until it creates a privacy, security, or competitive problem. The OECD's 2025 D4SME survey reported that 39% of SMEs used AI applications, up from 26% in 2024, while legal, privacy, and misinformation concerns stayed major barriers for non-users. Public traction pages now sit on top of payment, product, and model data that those founders are already uneasy about sharing.
Sort every tile into a tier before the link goes out. A fuller pass on what to show supporters is in our note on financial transparency.

| Tier | Who sees it | Typical metrics |
|---|---|---|
| Private | Founder only | Customer-level revenue, raw user lists, unreleased repository detail |
| Backer-only | People with a stake in the project | Rounded MRR range, churn rate, deployment frequency |
| Public | Anyone with the link | Aggregated MAU above threshold, commit counts, change failure rate |
Rules that move a metric
Round or range the money when the customer count is small. An exact MRR figure plus a public customer count can point at one account.
Set a minimum aggregation threshold. Do not publish a segment so small that one person can be picked out of it. Publishing MAU by a tiny niche can reveal behavior you never meant to share.
Delay sensitive operations by one release cycle. Commit counts and deployment rates can go out. File paths, branch names, and unreleased issue titles stay private, because repository detail can expose the roadmap.
Consent comes first for user-level or AI-related data. Do not put prompts, outputs, or individual usage on a page someone did not agree to.
Backers can still check a claim without raw rows: a source-connected rounded figure, its timestamp, and the tier it sits in. Verified metrics are extra context. They are not a guarantee of delivery or of future performance. Assign every tile a tier before the page goes live, and move it up a tier only when the threshold and the consent rule both hold.
Build Your First Dashboard This Week
Do the sequence in order. Each step exists so the next one has something honest to display.
- Write the one question the page must answer, in a single sentence.
- Pick three to five KPIs from the reference table. Leave the rest off.
- Define each metric in one sentence, including the window and the exclusions.
- Connect the sources. Stripe for MRR, GitHub for commits and deployments, analytics for MAU. Record a refresh timestamp on every tile.
- Set the cadence from the four layers: revenue daily, the rest weekly, unless your own close cycle is slower.
- Run the decision-grade checklist and assign a disclosure tier. A blank line means the tile waits.
- Publish a shareable page only after every tile passes. One option is Fundl, a reward-based crowdfunding platform where a verified traction page is free and does not require backers. You connect Stripe, GitHub, and analytics, and the project gets one URL with those live figures. A private sheet that follows the same checklist is just as valid.
Finish steps one through three before the week ends. Write the definitions down before you connect a single account.
Fundl turns that same checklist into a shareable traction page, with MRR, commits, and audience size refreshing from the tools you already use, so backers see source-verified numbers instead of a static pitch. If you want one link that shows the metrics you are willing to stand behind, visit Fundl and publish the page only after each tile has a definition, a source, and a disclosure tier.