
The popular advice says to put a big commit count on your page and let it prove you're shipping. That's backwards. A commit count is an eligibility-filtered signal, not a score, and it only holds up when readers can see which repositories, branches and authors passed the filter. Build a GitHub activity tracker that labels what it leaves out, and the numbers become credible. Leave the scope unstated, and even accurate data invites the wrong conclusion.
Table of Contents
- Which GitHub Activity Metrics to Track
- How to Connect GitHub With a Read-Only Token
- Pull, Store and Refresh Weekly Commit Data
- Which Commits Count and Why Numbers Look Wrong
- What Activity Data Cannot Prove
- Publish Your Traction Page With Live Metrics
Which GitHub Activity Metrics to Track
A single commit count misleads, so track a small set of metrics, each with a named source and a caveat printed beside it. GitHub defines a contribution broadly, covering commits, pushes, issues, pull requests, comments, discussions, repository creation and pull request reviews. Commits are only one slice of that activity, and visibility narrows it further.
That scope matters because the GitHub Octoverse 2024 report found that for October 1, 2023 through September 30, 2024, developers made nearly 1 billion contributions to public and open source repositories, while more than 82% of all GitHub contributions, 4.3 billion, occurred in private repositories. A public-only tracker therefore sees a minority of activity. Say so on the page instead of letting visitors assume they've seen everything.
Metrics a GitHub Activity Tracker Should Report
| Metric | What it counts | Source | Caveat |
|---|---|---|---|
| Commits per week | Non-merge, non-empty commits in each week | Repository statistics, commit activity endpoint | Excludes merge commits |
| Active weeks | Weeks in the past year with at least one commit | Derived from weekly totals | Gaps can mean a pause, not inactivity |
| Rolling four-week activity | Commits summed over the latest four weeks | Derived from weekly totals | Smooths release spikes |
| Contributor commit counts | Commits per author | Contributor statistics endpoint | Excludes empty commits |
| Merged pull requests | Pull requests merged into the default branch | Pull requests API with merged state | Better shipping signal than raw commits |
| Verified human-authored commits | Commits matched to team emails, bots removed | Derived from commit author data | Needs a maintained identity map |
I'd start with weekly commits, merged pull requests and active weeks. They're cheap to pull, hard to inflate, and they answer different questions about cadence, shipped work and consistency. If you want those signals tied to delivery outcomes rather than output alone, it helps to measure sprint outcomes for your MVP and compare your tracker against frameworks like the ones in this guide to GitHub DORA metrics for engineering teams.
Write the scope line that sits beneath the metrics before you publish anything. For example: public repositories only, default branch, non-merge commits, past 52 weeks, bots excluded. That one sentence does more for trust than a larger number ever will.
How to Connect GitHub With a Read-Only Token
Use a fine-grained personal access token with read-only access. A classic token grants broader access than a tracker needs, and a leaked broad token gives an attacker more to work with. The setup below limits the blast radius while still reaching the statistics endpoints.
The process is short enough to follow step by step.
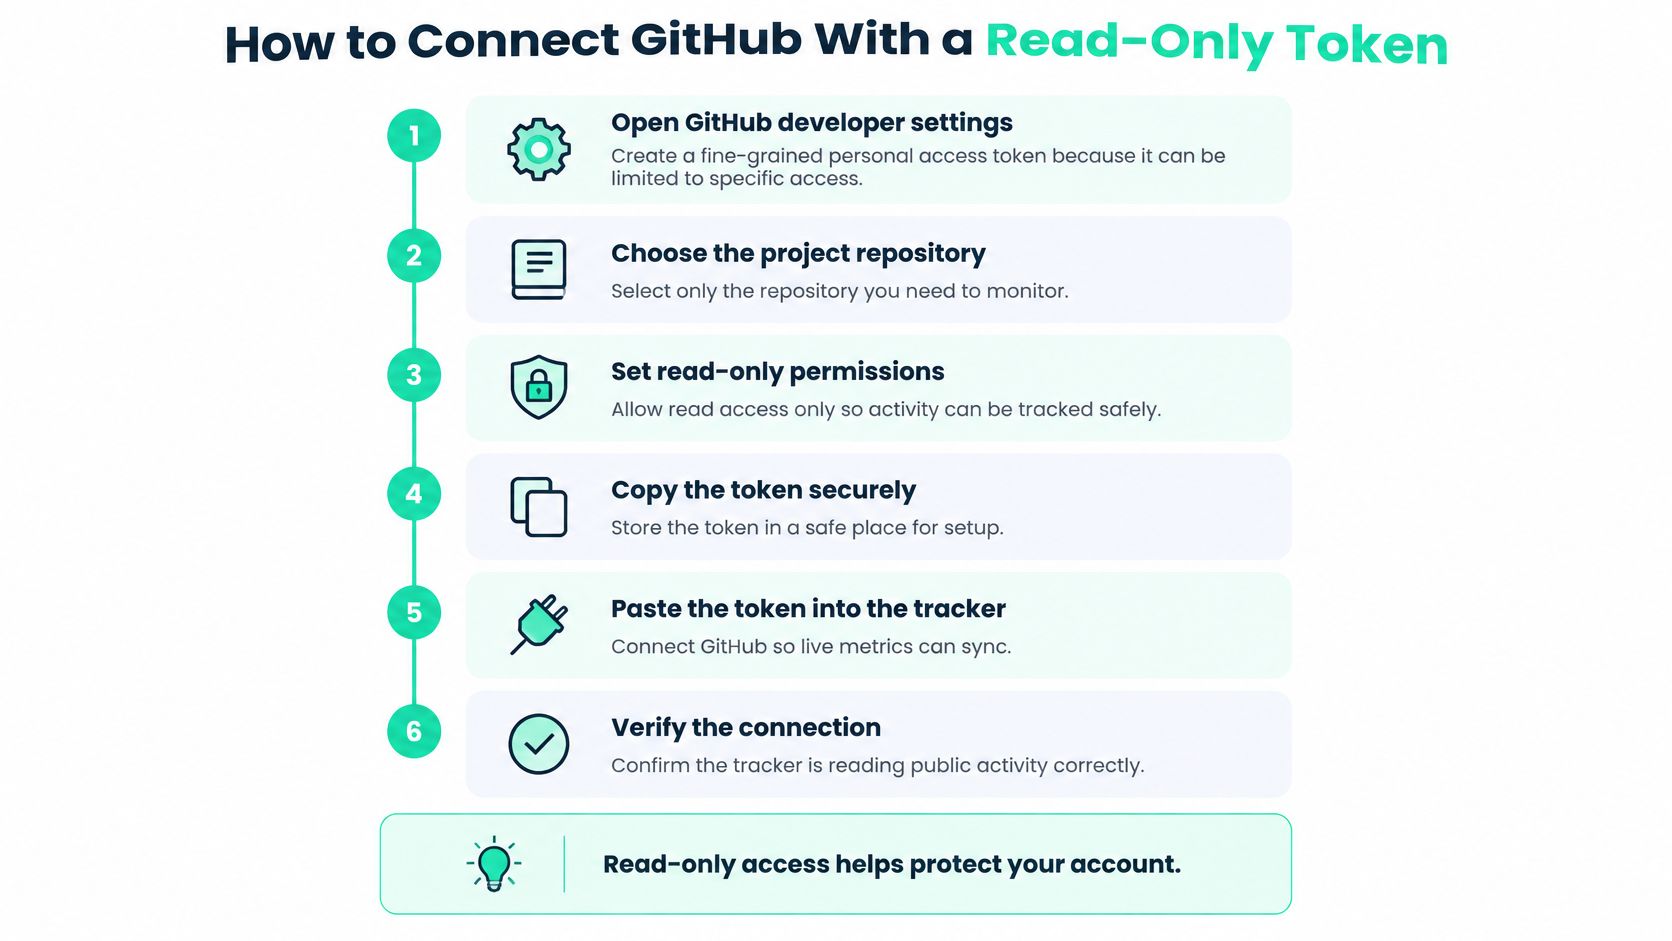
- Open GitHub developer settings and create a fine-grained token. Fine-grained tokens can be limited to specific repositories, which limits the damage if the token leaks. Don't reuse a token created for another tool.
- Select only the repositories the tracker needs. Adding every repository you own exposes metadata you never display. Keep the list to the projects appearing on the page.
- Grant read-only Metadata access and nothing else. The statistics endpoints need no more than that. If a permission screen asks for write access, you've chosen the wrong option.
- Set an expiry date and store the token safely. An expiry such as 90 days forces a review instead of leaving a permanent credential in place. Store it in a secret manager or environment variable, never in a repository or in client-side page code.
- Make one test call to the repository statistics endpoint. Expect a 200 response with data, or a 202 while GitHub computes the statistics. On a 202, wait a few seconds and retry rather than treating the repository as inactive.
- Read the rate limit headers and log the remaining quota. Logging what's left after the test call tells you how much headroom your refresh routine has. It also surfaces a misconfigured loop before it exhausts your quota, which matters if you later move to an OAuth flow and need to handle OAuth token refresh without breaking sync.
Practical rule: If the token can write, delete or administer anything, it's the wrong token for a read-only tracker.
Success looks specific. You get a 200 response containing 52 weekly entries for an active repository, and you've logged a remaining-quota number you can check after every run. Anything less means the connection isn't ready to automate yet.
Pull, Store and Refresh Weekly Commit Data
Use GitHub's repository statistics API rather than scraping contribution graphs. Scraped graphs break when the page layout changes, and they don't give you the daily buckets or timestamps you need to audit a figure later. The GitHub repository statistics API documentation states that the weekly activity endpoint only supports repositories with fewer than 10,000 commits and returns HTTP 422 beyond that threshold, so plan the pull around that limit.
The Pull and Store Procedure
- Request the 52-week commit activity endpoint for each tracked repository, authenticated with your fine-grained token. This is your primary series, so every other metric derives from it.
- Store each week's total and its seven daily buckets, keyed by repository and week start date. Keeping the daily buckets lets you rebuild weekly views without calling the API again.
- Request contributor statistics separately, and only when per-person attribution is needed. GitHub's statistics exclude merge commits, and contributor statistics also exclude empty commits, so the two series won't match exactly.
- Normalize the results into commits per week, active weeks and rolling four-week activity. Do the math in your store, not in the browser, so every visitor sees the same derived numbers.
- Label the output as "non-merge, non-empty commit activity" wherever it appears. Nobody should read it as total repository change.
- Check each repository's commit count before relying on the endpoint. A repository near the threshold will fail later if you don't add a fallback now.
Run that size check before the pull fails in production.
| Repository condition | What GitHub returns | What the tracker should do |
|---|---|---|
| Fewer than 10,000 commits | Weekly commit activity for 52 weeks | Cache each week and refresh on schedule |
| 10,000 commits or more | HTTP 422 from the weekly endpoint | Switch to incremental commit-history ingestion with checkpoints |
| Statistics still computing | HTTP 202 | Wait a few seconds and retry before storing |
Dropping a large repository from the page because the endpoint returned 422 isn't a design choice, it's a bug. Incremental ingestion with checkpointing costs more to build, but it keeps your biggest, most credible project visible instead of disappearing.
The Refresh Routine
Cache immutable historical weeks permanently and refresh only the newest week on each run. Historical totals don't change, so re-pulling them wastes quota and creates needless chances for a transient error to overwrite good data. Record the API timestamp for every pull, and publish a last-refreshed label next to every figure. That label lets a reader tell delayed aggregation apart from genuine inactivity.
There's a second reason to be explicit about freshness. A study covered in Empirical Software Engineering on invisible developer contributions found that developers also contribute through design-document reviews, mentoring, meetings, and other work that GitHub does not record. Your refresh routine can be perfect and the dataset will still be partial. Store the data rigorously, then describe its limits just as rigorously.
Cache what's finished, refresh what's current, and timestamp everything. Most tracker disputes are really freshness disputes.
Which Commits Count and Why Numbers Look Wrong
A commit count doesn't equal progress. It equals the number of commits that passed GitHub's eligibility rules for a particular view, and those rules filter out real work every week. Treat the output as a contribution-eligibility signal and verify it before you publish.
Run this five-step sequence for each repository. First, confirm the repository and its default branch. Second, map author emails to the claimed GitHub identity. Third, exclude forks unless a merged pull request shows upstream contribution. Fourth, separate authored commits from repository-wide commits. Fifth, show a data-quality warning when identity or branch coverage is incomplete.
The reason step two matters is in GitHub's guide to troubleshooting missing contributions, which states that GitHub counts a commit toward a contribution graph only when the commit email is connected to that account or uses the account's GitHub-provided noreply address, the commit is in a standalone repository rather than a fork, and it lands on the default branch or gh-pages branch. It also notes that contributions can take up to 24 hours to appear. Auto-refresh doesn't mean real time.
Common Tracking Errors, Causes and Fixes
| Symptom | Likely cause | Fix |
|---|---|---|
| Commits missing from totals | Commit email not linked to the GitHub account | Link the email or use the GitHub noreply address |
| Active feature work not counted | Commits sit on branches not yet merged | Count merged pull requests and label branch-only work separately |
| Totals inflated by a fork | Fork commits counted as original work | Exclude forks unless a merged pull request shows upstream contribution |
| Recent work not yet visible | Contributions take up to 24 hours to appear | Show a last-refreshed time instead of implying real time |
| Activity spike in one week | Release batching or cleanup commits | Show a rolling four- or eight-week baseline beside the weekly figure |
| Founder activity looks inflated | Bot commits counted as human work | Filter bot authors before calculating human-authored commits |
Report three separate fields instead of one blended total: total repository commits, verified human-authored commits and merged pull requests. When those three move differently, a reader can see whether the team shipped, whether bots did the work, or whether a release batch landed at once. Cherry-picks are worth a specific check too, since the same change can be counted twice if you sum across branches without deduplicating.
What Activity Data Cannot Prove
Don't trust a low week until you know what the tracker can't see. GitHub doesn't record design-document reviews, mentoring, meetings or customer support. Some work sits in non-public repositories, and some organization activity is anonymized to outside viewers, so a public dashboard is an incomplete picture by construction.
A low commit count may reflect coordination, product discovery, maintenance or deliberate prioritization rather than inactivity. That distinction matters most for small teams, where one person might carry customer support, architecture and security alongside code. If that person spends a week on a security review, your chart drops while the project's risk improves.
A tracker that rewards visible volume will eventually get visible volume, whether or not the work mattered.
Separate the signals so readers don't collapse them into one judgement:
- Shipping signals: commits, merged pull requests and release frequency show that code reached users or the default branch.
- Collaboration signals: review participation, issue resolution and documentation changes show that the team is unblocking each other and explaining decisions.
Don't rank people or projects by raw totals. Ranking turns a diagnostic into an incentive, and the cheapest way to climb a commit ranking is to split work into noisy, performative commits. You end up measuring who games the metric, not who moves the product.
Show each figure with its scope: which repositories, which branches, which identities, which time window, and what's excluded. Then do the check before you share the page. Write one sentence stating what the numbers cover and what they don't, and add a short qualitative note beside any week that looks unusually low. If you can't explain a dip in one sentence, you don't understand your own data well enough to publish it.
Publish Your Traction Page With Live Metrics
A live page earns more trust than a screenshot because the numbers keep moving after you publish. On Fundl, each project receives a shareable URL that shows its live verified metrics in one link, and you can connect Stripe for revenue, GitHub for commit activity and analytics for audience size. Treat the GitHub figure as an eligibility-filtered signal: commits that pass your repo, branch, author and window rules count; everything else is excluded and labeled.
Here's an example of a clear layout to model your own page on.
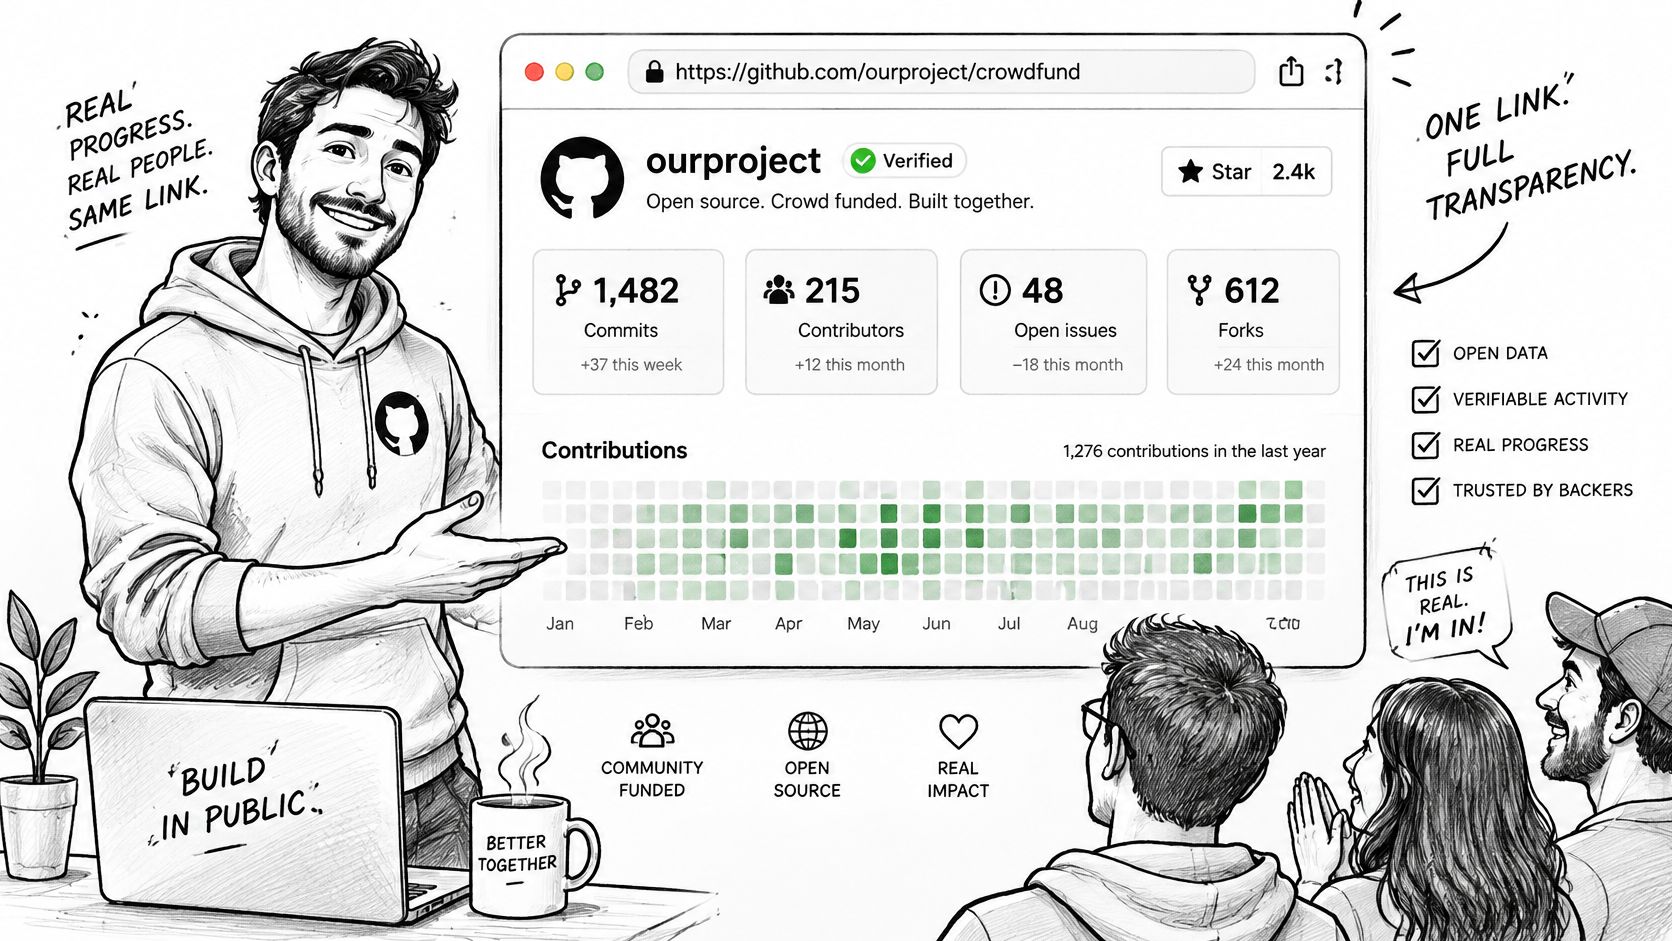
Publish it in five steps. First, choose the three metrics that match your goal and write the filter for each before you connect anything. Second, connect GitHub with a read-only token and, if revenue appears on the page, connect a valid Stripe account so contributions can reach you. Third, let Fundl refresh connected data automatically so backers see the latest numbers, then open the page once as a visitor would. Fourth, add the link to your project profile and any launch post. Fifth, put the scope line beside the chart and mark any low week with a short reason; if several sources feed one page, integrating data sources into a single traction view covers the connection order.
For the activity visual, use a bar chart of the 52 weekly commit totals with a rolling four-week line drawn over it, and place the scope line directly beneath. Bars show spikes, the line shows trend, and a label such as "excludes forks, bots and private repos" stops readers from filling gaps with guesses. If you render your own chart before connecting it, stamp when the pull ran; on the live page, the source refresh is the freshness signal.
Creating a verified traction page is free and doesn't require any backers, so there is no reason to wait for an audience before you build it. Keep the claim accurate: describe goals and intended use of funds completely, state what the numbers cover, and leave delivery risk with the reader where it belongs. Publish this week with three metrics, then share the link only after the page reads cleanly to someone who has never seen your repo.
Connect your GitHub repository to Fundl and publish a free verified traction page that shows your weekly commit activity alongside revenue and audience metrics in one shareable link. Your numbers refresh automatically from the source, so backers see current shipping evidence rather than screenshots. Set up your page today, add your scope line, and share the link in your next launch post.