

Most advice about building an MRR dashboard starts with the charts: connect Stripe, add a revenue card, and refresh it as often as possible. That's the wrong order. A fast-moving number isn't useful if you can't explain which subscriptions changed, when those changes took effect, and why the closing balance matches billing.
Start with the ledger, not the layout. For a solo founder, that means a small, inspectable dataset with explicit billing rules, a source event behind every movement, and a reconciliation check that stops unexplained numbers from reaching backers.
Table of Contents
- What an MRR Dashboard Has to Show
- MRR Movement Categories and Formulas
- How to Connect Stripe and Normalize Billing Data
- Cohorts, Segments and Retention Benchmarks
- Billing Edge Cases That Change Your MRR
- Visualize Trends and Automate Refreshes
- Common Dashboard Errors and How to Fix Them
- Publish the Verified Dashboard as Live Traction
What an MRR Dashboard Has to Show
A headline MRR figure tells you the size of the recurring base. An explained figure tells you whether customers are joining, upgrading, downgrading, leaving, or returning. Your dashboard needs both.
Monthly recurring revenue is the normalized monthly value of subscription revenue you expect to generate, excluding setup fees, one-time purchases, professional services, and other non-recurring income. The Stripo SaaS metrics guide distinguishes this from cash collected and expresses ARR as MRR multiplied by 12, provided the underlying revenue recurs.
That distinction matters when annual customers prepay. Cash receipts can jump without a corresponding jump in normalized MRR. Likewise, new sales can lift the total while cancellations weaken the existing customer base.
Show the balance and its causes
Split changes into new, expansion, contraction, churned, and reactivation MRR. A backer should be able to inspect the movement behind growth rather than infer customer health from an upward line.
Write the definitions before configuring the cards. Rite NRG's resource on governed reporting pipelines and metric contracts provides useful context for documenting how reporting definitions and pipelines fit together. For a solo founder, the practical version is a plain policy document stored beside the calculation logic.
Keep these fields visible on every view:
- Inclusion rules: Explain how annual contracts, usage, pauses, discounts, refunds, and failed payments affect the calculation.
- Source timestamp: Show when the underlying billing data was last retrieved, not merely when the browser refreshed.
- Period status: Label the displayed month as closed or in progress.
Don't hide those qualifications in a tooltip nobody opens. They determine what the headline means.
MRR Movement Categories and Formulas
Use the following hypothetical subscription changes to test your movement logic before importing the full customer base.
| Movement | What triggers it | Counting rule | Example |
|---|---|---|---|
| New MRR | First paid subscription starts | Monthly value of the new subscription | A $49 monthly plan starts = $49 new MRR |
| Expansion MRR | Upgrade, added seats, or qualifying recurring usage | Increase in monthly value for an active customer | A $60 plan becomes $100 = $40 expansion |
| Contraction MRR | Downgrade or fewer seats | Decrease in monthly value while the customer stays active | A $100 plan becomes $60 = $40 contraction |
| Churned MRR | Cancellation takes effect | Full prior monthly value is lost | A $49 plan cancels = $49 churned MRR |
| Reactivation MRR | Former customer returns | Monthly value of the returning subscription | A former customer returns on a $49 plan = $49 reactivation |
Classify changes at the customer level, while retaining subscription-level evidence. Otherwise, replacing a subscription during a plan migration can look like a cancellation and a new sale even though the customer never left.
Calculate losses without hiding expansion
The ChartMogul SaaS metrics cheat sheet provides the underlying gross-churn and retention framework:
Gross MRR churn = (Churn MRR + Contraction MRR) ÷ Starting MRR
NRR = (Starting MRR + Expansion MRR + Eligible reactivation MRR − Contraction MRR − Churn MRR) ÷ Starting MRR
Express each result as a percentage. Gross churn can't be negative because it measures losses before offsets.
For a hypothetical month starting with $10,000 MRR, suppose cancellations remove $400 and downgrades remove $100. Gross MRR churn is ($400 + $100) ÷ $10,000 = 5%.
Using that same hypothetical starting cohort, suppose expansion contributes $700 and eligible reactivations contribute $100. NRR becomes ($10,000 + $700 + $100 − $100 − $400) ÷ $10,000 = 103%. Net MRR churn is therefore −3%, despite the losses.
Practical rule: Display gross churn beside net churn. Expansion can offset losses mathematically without fixing the reasons customers leave.
Reactivation requires care: include it in retention only when the returning customer belongs to the cohort being measured. Never add unrelated returning customers to improve a fixed cohort's result.
The wider set of SaaS growth metrics helps put these measures in context, but the operating requirement remains simple: every movement must trace to a subscription event. Store the prior value, revised value, effective date, and classification so you can reproduce the calculation rather than trust a saved total.
How to Connect Stripe and Normalize Billing Data
Keep the first implementation narrow: Stripe as the billing source, a subscription-event table, and a monthly ledger. You don't need a warehouse project before you can inspect recurring revenue.
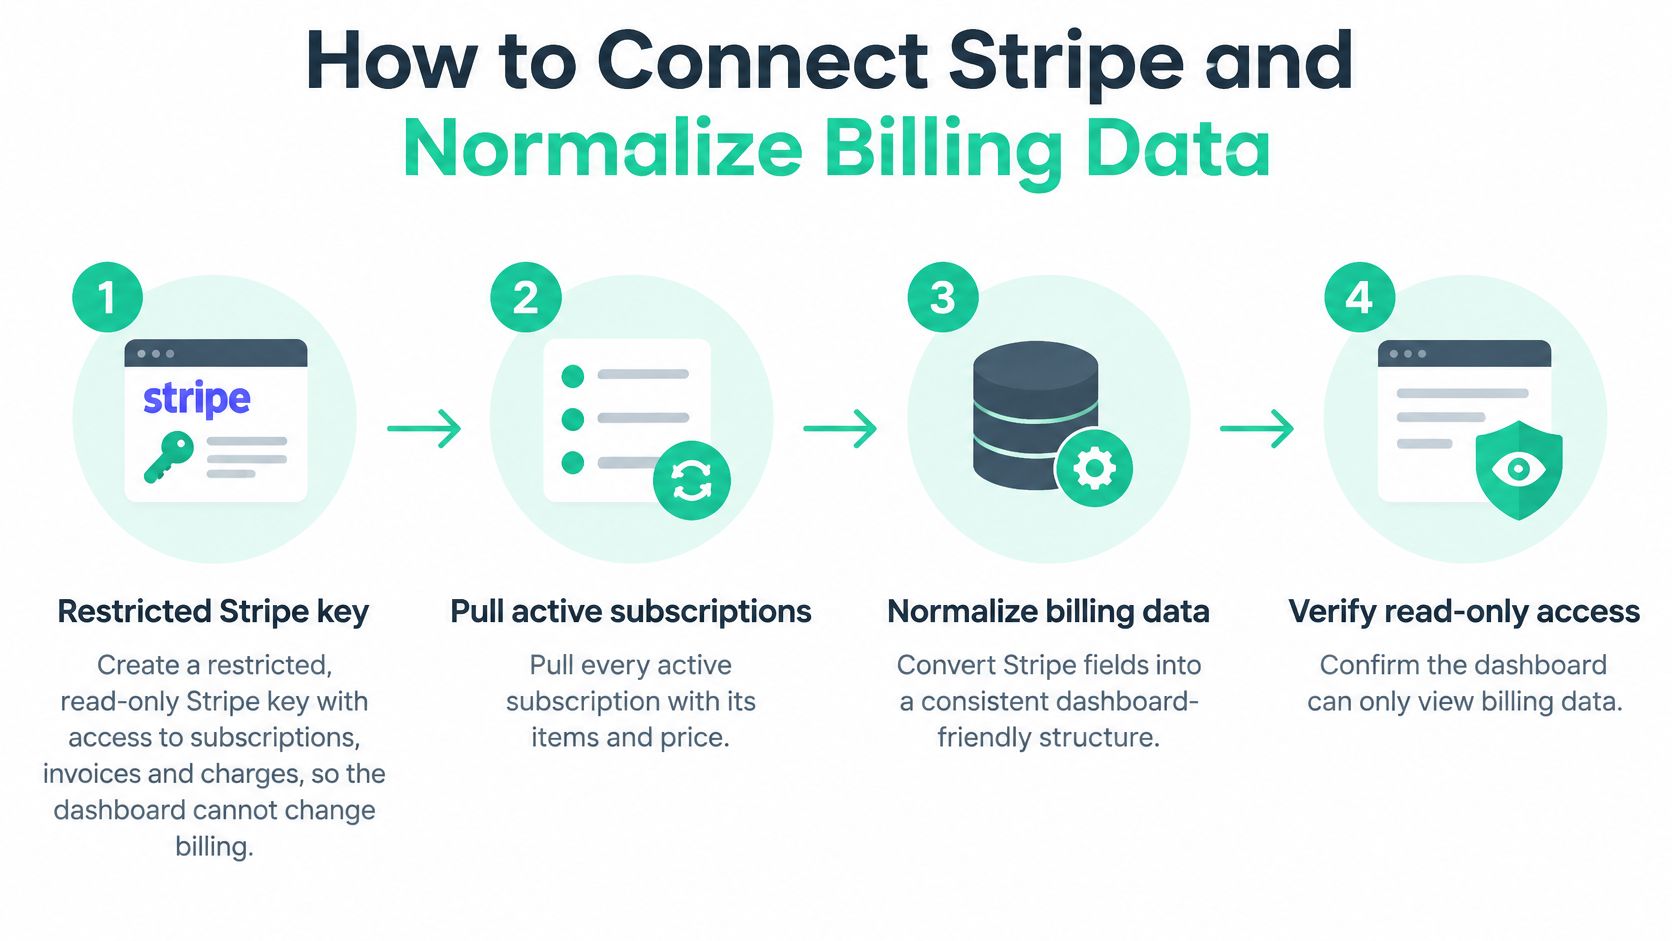
Use this connection flow as a setup checklist.
Build the source-to-ledger path
Create restricted, read-only access. Give the integration the read permissions it needs for subscriptions, prices, invoices, and charges, then test that it cannot modify billing. Don't use an unrestricted secret key just because it makes the first connection easier.
Pull active subscriptions with their items and price intervals, then retrieve historical subscriptions and events needed for the reporting window. Charges alone won't tell you the normalized recurring base, and an active-only export can omit customers who already churned.
Normalize recurring amounts to monthly values. Divide the eligible recurring amount by the months covered by its billing interval, accounting for quantity and recurring discounts. The common slip is treating the invoice's full annual amount as the subscription's monthly contribution.
Choose a reporting currency and store the exchange rate, rate date, and conversion rule with the calculation. Separate currency effects from commercial movements so exchange-rate changes don't masquerade as upgrades or downgrades.
Preserve the event trail. Store the source event ID, subscription ID, customer ID, source timestamp, effective timestamp, and before-and-after values. Deduplicate incoming events by ID rather than assuming each delivery represents a new change.
Exclude one-time charges, taxes, refunds, failed-payment amounts, and pass-through amounts from recurring-revenue inputs. A refund belongs in the billing bridge, not automatically in contraction; a separate subscription change may still require an MRR movement.
Validate relationships and timing. Flag duplicate subscription IDs, overlapping intervals, currency mismatches, unsupported negative movements, and subscriptions that start and cancel within the same month. Investigate those last cases rather than netting them away.
Build the monthly reconciliation: opening MRR + new + expansion + reactivation − contraction − churn = closing MRR. Compare each subscription's normalized balance with its billing evidence, not the aggregate MRR figure with Stripe's cash balance.
Make discrepancies inspectable
DataDank's data-platform guidance emphasizes billing reconciliation, freshness checks, relationship tests, and explicit movement logic, including the risk that inner joins omit newly acquired or churned customers. Use a full comparison of opening and closing customer populations, with unmatched records routed to review.
The practical trade-off is maintenance. A spreadsheet can support an initial review, but preserve stable identifiers and separate raw imports from calculated fields. That makes a later move to automated storage much less disruptive.
For related implementation decisions, use the guide to integrating data sources. Keep credentials server-side and give public viewers access only to approved reporting outputs.
This walkthrough offers additional context for the connection workflow.
Cohorts, Segments and Retention Benchmarks
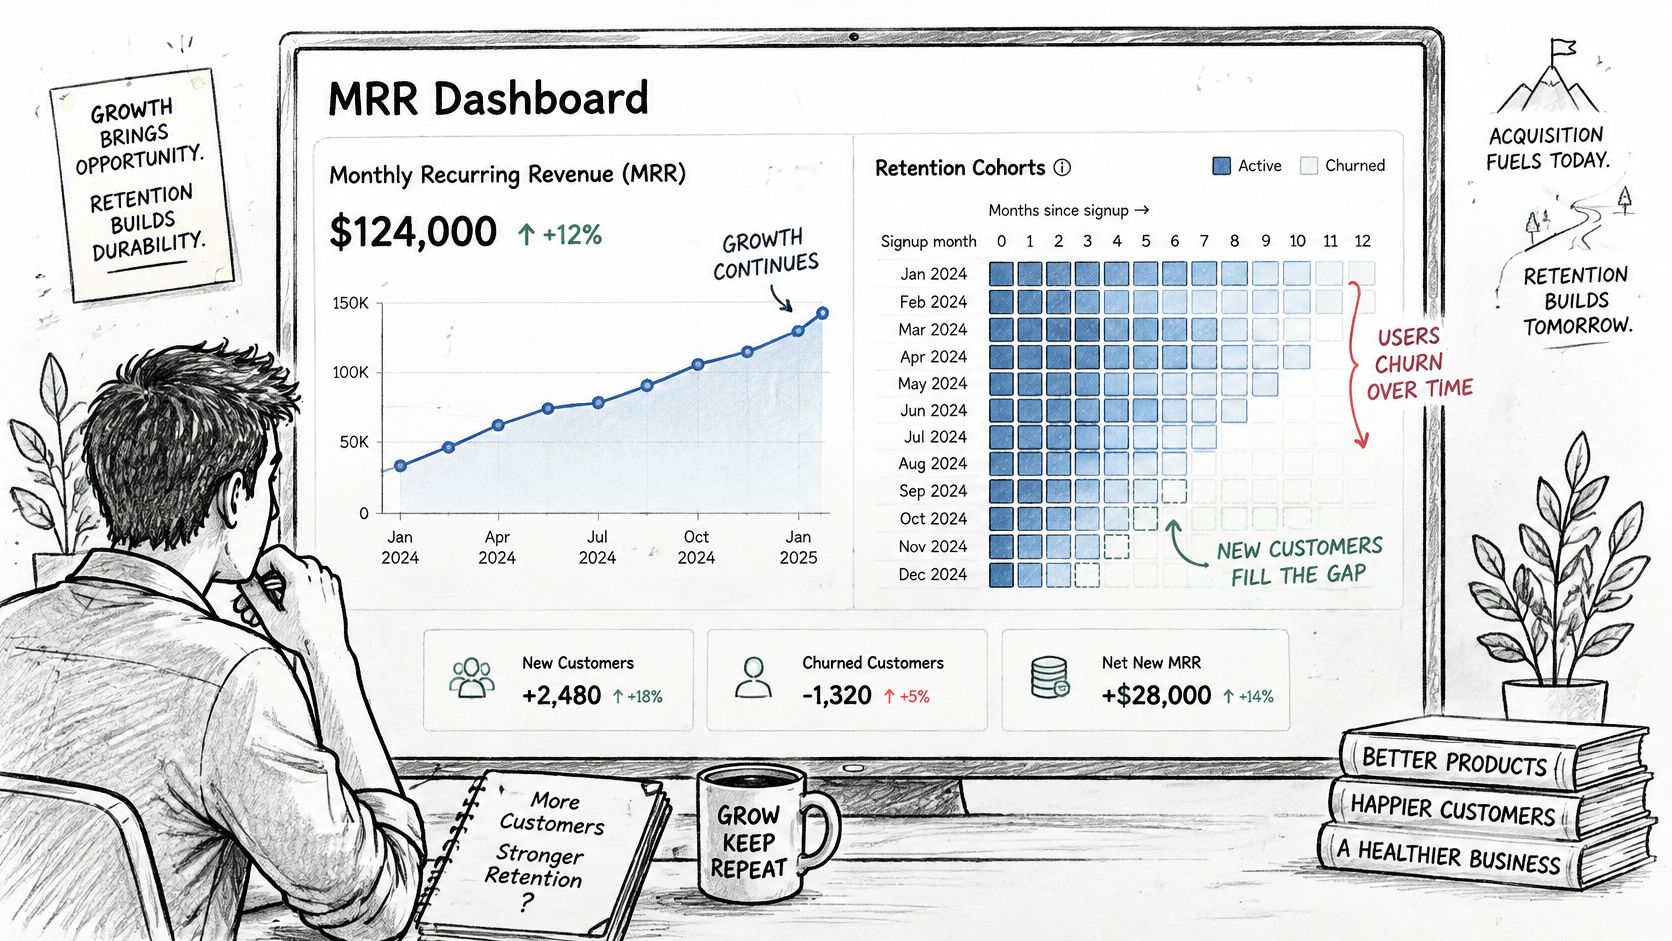
Total MRR can rise while retention deteriorates. New customers replace lost revenue, so the headline doesn't reveal whether earlier customers still find the product worth paying for.
SaaS Capital's 2025 survey of more than 1,000 private B2B SaaS companies reported median 2024 NRR of 101% and GRR of approximately 91%, as summarized by Acquire's SaaS benchmarks guide. The gap distinguishes revenue preserved before upsells from revenue retained after expansion offsets losses.
Benchmarkit's 2025 B2B SaaS performance report also placed overall median NRR at 101%, according to the Statistics Fundamentals SaaS statistics summary. That corroborates the broad benchmark, but it doesn't make it a universal target for an indie product.
Fix membership before measuring retention
Group customers by signup month, and record the recurring revenue from which each cohort's retention measurement begins. For products with long free trials, retain both signup month and first-paid month so delayed conversion doesn't make the revenue baseline ambiguous.
Freeze cohort membership. Subsequent new customers belong to later cohorts, even if they buy the same plan through the same campaign. Calculate retained revenue using only the customers assigned to the original group.
A cohort view should make the relationship between growth and retention visible.
Segment only when the comparison is useful
Start with segments that map to decisions you can make:
- Plan tier: Identify whether a pricing package attracts customers who later downgrade or leave.
- Billing interval: Compare renewal behavior without treating an annual customer's prepaid term as proof of a successful renewal.
- Acquisition channel: Check whether a channel brings customers who remain, rather than merely customers who initially convert.
- Customer concentration: Show account counts and flag segments dominated by a large customer.
Don't create a dense matrix of tiny groups. Combine sparse segments or label them as limited evidence, and avoid public customer-level details that expose private commercial information.
A modest recurring base with consistent cohort expansion can provide stronger evidence of demand than faster acquisition followed by rapid customer loss.
Benchmarks remain directional because pricing model, customer size, geography, and product maturity affect retention. For backers, present acquisition growth and existing-customer performance as separate observations. Don't let either stand in for the other.
Billing Edge Cases That Change Your MRR
Stripe totals are not automatically MRR. Stripe records billing activity; you still have to decide which activity represents an ongoing subscription commitment and when a change becomes effective.
Basedash's SaaS revenue dashboard guide illustrates annual normalization with a $12,000 annual plan representing $1,000 MRR and explains why cash, variable revenue, and cancellation timing need separate treatment.
| Billing case | Recommended treatment | Effect on the chart |
|---|---|---|
| Annual prepayment | Spread the recurring amount across the covered months | Cash rises on payment; normalized MRR doesn't show the entire receipt |
| Plan switch from a higher to a lower price | Record the difference as contraction while the customer remains active | Avoids presenting the full former subscription value as lost |
| Cancellation requested mid-period | Use access expiry as the effective date and disclose the policy | Churn appears when paid access ends, which may be in a later month |
| Failed payment before retry | Flag as at-risk; exclude unpaid amounts under a disclosed paid-status policy | Prevents unpaid billing attempts from appearing as secure recurring revenue |
| Refund on a paid period | Log the refund separately; assess any subscription change independently | Keeps cash adjustments distinct from recurring-plan movements |
| Usage-based overage | Show unpredictable overages as variable revenue outside normalized MRR | Separates the committed base from consumption-driven revenue |
Annual cash and cancellation timing need explicit policies
Annual prepayments are especially easy to misread when a founder uses invoice charts as revenue charts. Keep cash collected, normalized MRR, and accounting revenue separate. Each answers a different question, and none should substitute for another.
Cancellation timing requires a deliberate choice. Recording the request date describes customer intent; recording access expiry describes when the paid subscription ends. For an operating MRR dashboard, I'd use access expiry and show requested cancellations separately as forward-looking risk.
That policy won't always move churn into the following month. It moves churn to the actual effective period, which depends on the customer's paid-through date.
Separate payment risk from product loss
Failed payments need their own state transitions. Under a paid-status policy, removal during delinquency and restoration after recovery should carry payment-related reason codes, so a retry doesn't look like a newly acquired customer.
Likewise, a goodwill refund doesn't necessarily change the ongoing subscription price. A recurring discount does. Inspect the subscription terms rather than converting every negative cash event into contraction.
Publish a compact policy statement beside the dashboard:
Revenue policy: Annual contracts are monthly-normalized; recurring discounts reduce subscription value; unpredictable overages remain variable revenue; cancellations take effect at paid-access expiry; payment failures follow the disclosed delinquency policy; refunds are tracked separately unless subscription terms change.
Add the treatment of paused subscriptions to that statement. Decide whether a pause suspends billing and service or merely delays collection, then apply the rule consistently.
Visualize Trends and Automate Refreshes
Build charts only after the underlying ledger reconciles. A solo founder needs views that answer operational questions, not a screen full of loosely related cards.
Give each chart a job
- Closed-month MRR line: What recurring balance did each completed month end with? Display the in-progress month separately so viewers don't mistake a partial period for a finished result.
- Movement waterfall: Why did the balance change? Show opening MRR, each movement category, and closing MRR, including offsetting movements when the net change is small.
- GRR and NRR lines: How is the existing customer base performing? Use matching periods and cohort rules so the comparison is meaningful.
- Signup-cohort heatmap: Are newer customer groups retaining differently? Show retained recurring revenue relative to each group's starting balance, with customer counts available for context.
Use a consistent reporting currency. Keep scales consistent across comparable charts, and label revenue retention separately from customer retention.
Automate recovery, not just refresh
Subscribe to Stripe subscription, invoice, and charge events, then process deliveries into an idempotent event store. Queue failed processing attempts instead of dropping them, and record both the source timestamp and ingestion timestamp.
Run a nightly rebuild to compare current subscription state with the ledger. Include recently changed and ended subscriptions, not just active records, so a missed cancellation can still be detected.
- Stamp the snapshot: Include its billing cutoff and successful source-sync time.
- Hold incomplete periods open: Don't label an unfinished month as final or present its churn rate as complete.
- Gate publication: Publish only the last reconciled snapshot when a new refresh fails validation.
Faster ingestion is useful only when you can detect, replay, and explain a missed or duplicated event.
Alerts should identify the affected subscription and failed check. A notification that merely says revenue changed sends you back to manual investigation.
Common Dashboard Errors and How to Fix Them
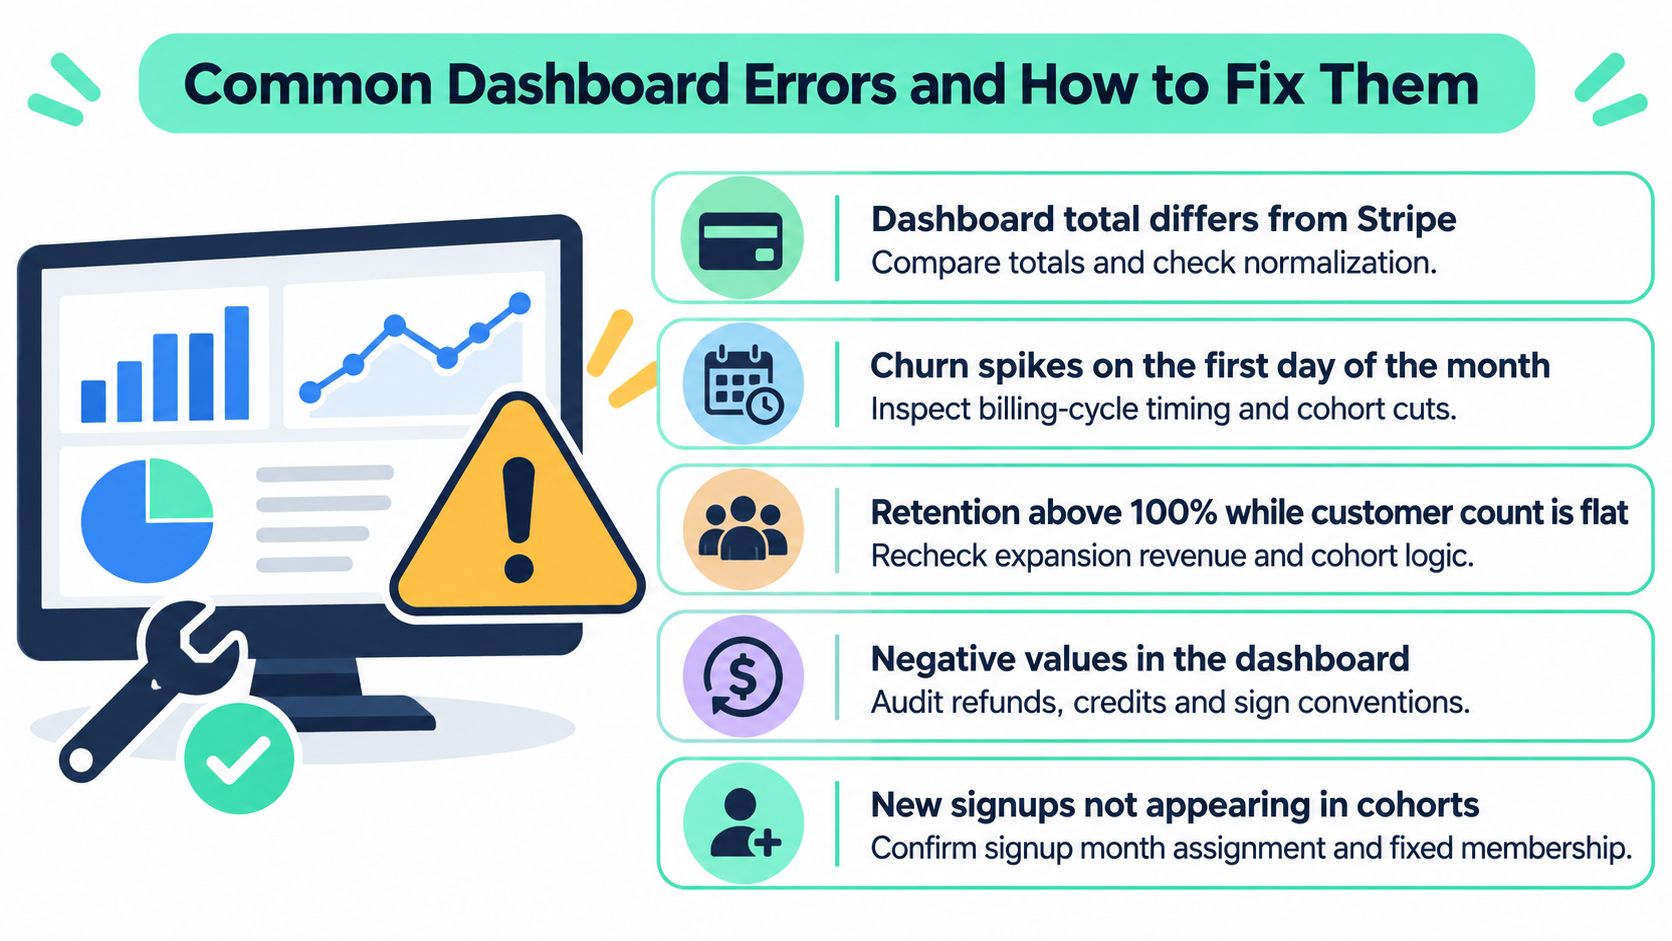
| Symptom | Likely cause | Fix |
|---|---|---|
| Total differs from normalized Stripe billing | Refunds or taxes included, or an inner join dropped customers | Reconcile each subscription to billing evidence to the cent |
| Churn spikes at the start of the month | Request dates or reporting boundaries used instead of effective dates | Apply the disclosed access-expiry rule and inspect boundary events |
| Retention exceeds the starting base while customer count is flat | Legitimate expansion, or new subscriptions incorrectly added to the cohort | Check expansion evidence and freeze cohort membership |
| Net churn is negative | Expansion outweighs losses while gross churn is hidden | Display gross churn beside net churn |
| Closed month changes later | Late webhooks, retried payments, or retrospective corrections | Rerun through the cutoff and publish an explicit restatement if necessary |
Treat these symptoms as investigation prompts, not automatic proof of a bug. Flat customer count can coexist with healthy expansion, and a billing-cycle concentration can create a genuine churn spike.
Use this troubleshooting checklist when a refresh produces an unexpected result.
Partial periods need different labels
ChartMogul's gross MRR churn documentation describes adjusting an incomplete-period observation by multiplying it by total days in the period divided by days elapsed. That's a full-period estimate, not an observed final result and not, by itself, an annualized rate.
If you display such an estimate, label the method and the elapsed period. Early-period cancellations may be clustered around billing dates, so extrapolation can mislead even when the arithmetic is correct.
For a public view, I'd prioritize completed-period churn and show in-progress losses as clearly labeled operating information. Don't imply precision the period hasn't earned.
Audit denominators and signs
Customer churn uses customers at the start of the period, not the ending population. Revenue retention uses the defined cohort's starting recurring revenue, not total revenue from everyone currently paying.
Check sign conventions at ingestion. Store loss magnitudes consistently, then subtract them in formulas; mixing signed losses with subtraction can accidentally turn churn into growth.
Finally, a closed-period correction needs a visible explanation. Preserve the prior snapshot, record the corrected source events, and identify whether the change came from late billing evidence or revised calculation logic.
Any unexplained reconciliation variance removes verified status from that snapshot. Don't absorb it into an adjustment bucket merely to make the closing balance match.
Publish the Verified Dashboard as Live Traction
Publish when a live, defined revenue view gives backers better evidence than a screenshot. You don't need dramatic growth, but you do need a recurring base whose movements you can explain.
Before sharing, confirm the publication essentials:
- Definitions: Disclose treatment of annual contracts, usage, pauses, discounts, refunds, and payment failures.
- Freshness: Show the source timestamp, billing cutoff, and closed or in-progress status.
- Retention context: Present gross and net churn together, with NRR and GRR over matching periods.
- Reconciliation: Make opening MRR, categorized movements, and closing MRR inspectable without exposing private customer data.
On Fundl, we can connect Stripe to show MRR, GitHub to show commit activity, and analytics or other audience signals to show audience size. We refresh connected data automatically, so the shareable page doesn't depend on manually replaced screenshots.
Use the guidance on showing traction to investors to frame the evidence without turning it into a promise. Verified metrics are additional context, not a guarantee of delivery or future performance.
Connect Stripe with read-only access, document your inclusion rules, and check the first reconciliation to the cent before sharing your traction page in a launch or community post.
Fundl offers a shareable traction page with source-verified revenue, build activity, and audience signals that refresh automatically. Visit Fundl to connect your accounts and put a reconciled MRR figure beside the other evidence backers need to assess your project.